Ronald Aguilar
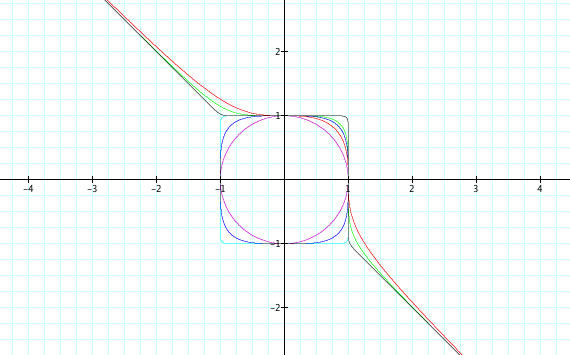
Here we are looking at the graphs of the equations
(in purple)
(in red)
(in blue)
(in green)
(in turquise)
(in black)
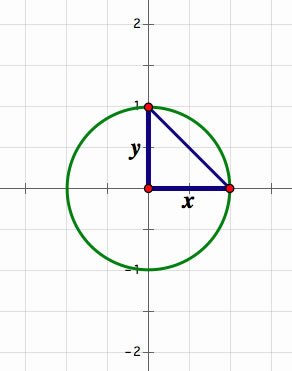
If we look at the equation
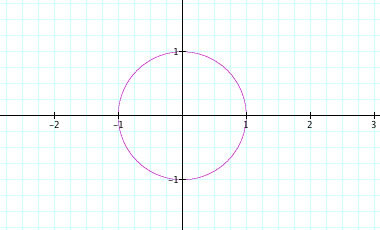
The point x(0,1) and the point y(1,0) is located on the unit circle in the 1st quadrant with both variables positive. X and Y are sides(legs) of a right triangle formed within the unit circle. Therefore the hypotenuse is 1 which is the radius.
The x and y variables are even with the variables being squared. This parameter requires the variables to reflect each other.
Since each variable is squared regardless, if it is negative or positive the values equal the same,
. If we reflect any point that satisfies the initial equation we get the unit circle. So any point on the unit circle can be
reflected across either axises(x and y).
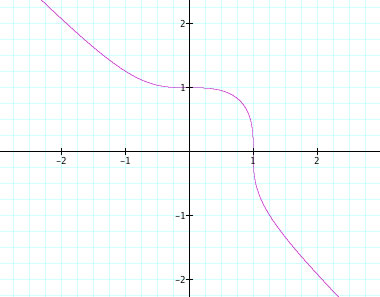
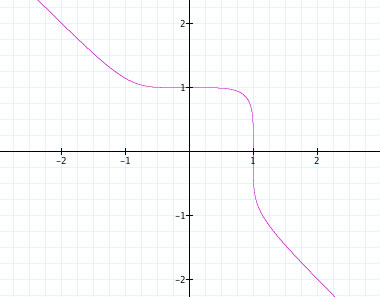
Next, let's graph the equation
The equation does not create an circle or variation of a circle. Instead, the equation creates what appears to be a line and then jumps creating a curvature which leads back into a line. The values of x and y are not squared or have an even factor, leading the values of x and y to have opposite values. Also, there is no reflection across the x and y axises. In this case there is no symmetry with y - axis but with the origin. -
.
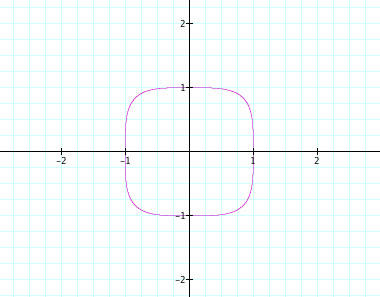
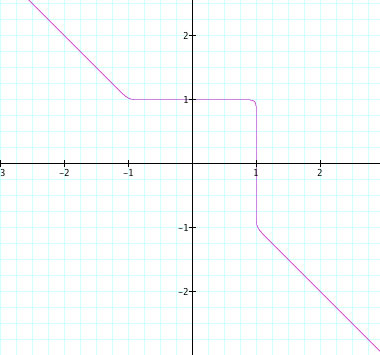
By graphing
edges are trying to intersect the points (-1,1) and (1,-1) but do not.
The x values are reflected across the y axis because the domain does not change the function.
.
Graphing
reflected across the origin and not the y axis. We will discuss the reason for the symmetry later.
.
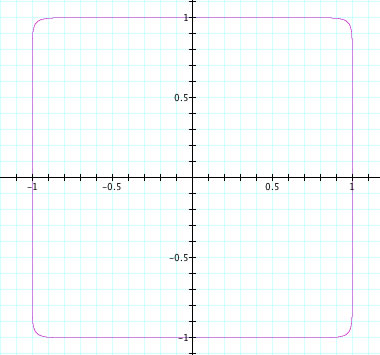
Now, lets perdict the graph of the equation
. The graph wants
to intersect at (1,1) but does not. The higher exponent at 24 makes the function almost intersect at (1,1), (-1,1), (-1,-1), (1, -1).
Now like we just did lets predict the graph of the equation
. Again, the graph is trying to intersect the point (1,1) but never does. The higher exponent at
25 makes the function almost intersect.
Understanding the concept of odd and even functions is very important in relation to this assignment.
If a graph is symmetrical to the y - axis it is considered an even function. F(-x) = F(x). The sign of the domain, x or y value in these equations does not change the positivity of the function.
If a graph is symmetrical to the origin it is considered an odd function. F(-x) = -F(x). The sign of the domain, x or y value in these equations does change the positivity of the function.
As we can now see no matter how high the exponents get the pattern of the graph is determined by the function and if it is odd or even.
EVEN Functions:
ODD Functions:
We can conclude that from looking at the above graphs of the functions, the odd and even functions fluctuate between 0 < x < 1. That is based on the equation
even. The x variable is substracted from 1 which make the y variable less than 1.
The even functions produce a circle starting with the function
because the x variable becomes smaller but the x value exponential gets closer to 1.