
Ronald Aguilar
Here we investigate the equation
and we are looking at the variable a which is the coefficient. First, lets graph the basic equation for a parabola,
.
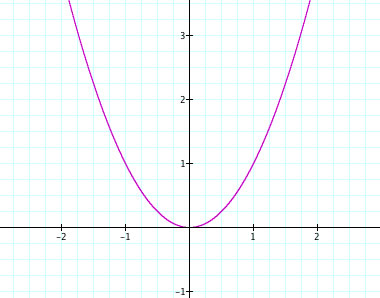
Notice how the graph looks like a U. Now that we have seen the graph for
(graph in blue) and
(in red).
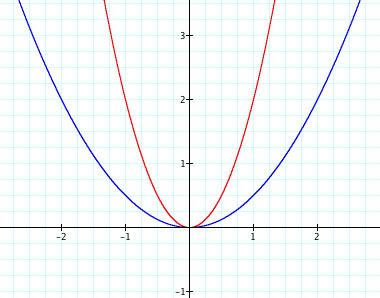
Notice how the graph of
After exploration of the positive coefficients of a parabola, the positive quadratic
The negative quadratic
is shown below where a = -1.
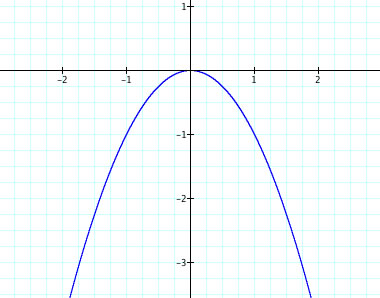
This is the graph
, we plug in 1 for x, we get y = -1. If we look at the graph we can see that graph intersects at (1,-1). Moreover, this function is odd. Plugging in -1 for x, gives us y = -1. The graph intersects (-1,-1) too.
Change the values of a gives us a better idea for how the value of a affects the graph. Below are the graphs of
(in black) and
(in red). As we can see the graph of
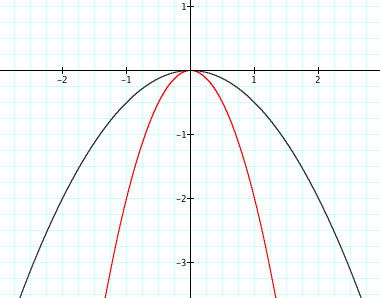
The negativity of the parabola reminds of an upside U. This upside down U reminds of a frown.
Lets explore the different variations of the coefficient a in the parabolic equation
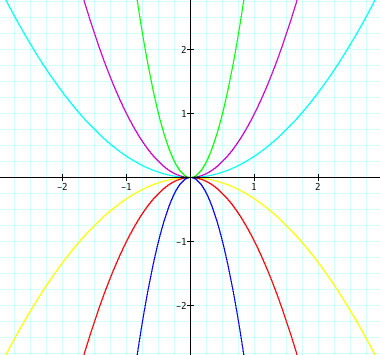
The graph of
Changing the value a indicates how fat/thick/wide or skinny/thin/slim the parabola will be.
1)If the absolute value of a (
) is less than 1 then the parabola gets wider because the equation
2) If the absolute value of a (
) is greater than 1 then the parabola gets slimmer because the equation
So in all actuality the coefficient determines how fast the parabola grows.