
When looking at quadratic equations, we often apply the quadratic formula to the standard form, a![]() + bx + c = 0, to find the roots. In this assignment, we will explore the roots of quadratics with particular values of a and c. We will first look at the case when a = 1 and c = 1, giving us the equation
+ bx + c = 0, to find the roots. In this assignment, we will explore the roots of quadratics with particular values of a and c. We will first look at the case when a = 1 and c = 1, giving us the equation ![]() + bx + 1 = 0. We can graph this in the xb plane to get the following hyperbola:
+ bx + 1 = 0. We can graph this in the xb plane to get the following hyperbola:
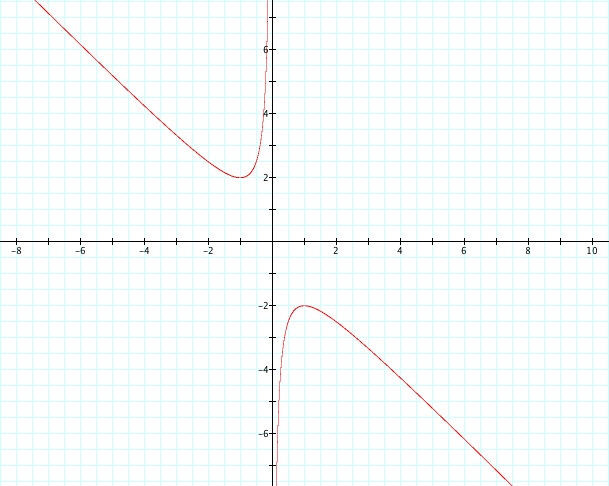
The hyperbola actually tells us the values of the roots of the equation ![]() + bx + 1 = 0 for particular values of b. We can do this by looking at the horizontal line segments of the graph and associating the horizontal line segment with its b value. When b = 2 or b = -2, we get exactly 1 root. When -2 < b < 2, there are no real roots. When b < 2, we have 2 positive roots. When b > 2, we have 2 negative roots. we can see that the hyperbola is asymptotic to the lines x = 0 and y = -x. This tells us that we will never have a negative root less than -b or a positive root greater than b.
+ bx + 1 = 0 for particular values of b. We can do this by looking at the horizontal line segments of the graph and associating the horizontal line segment with its b value. When b = 2 or b = -2, we get exactly 1 root. When -2 < b < 2, there are no real roots. When b < 2, we have 2 positive roots. When b > 2, we have 2 negative roots. we can see that the hyperbola is asymptotic to the lines x = 0 and y = -x. This tells us that we will never have a negative root less than -b or a positive root greater than b.
Next, we will look at similar hyperbolas for different values of c:
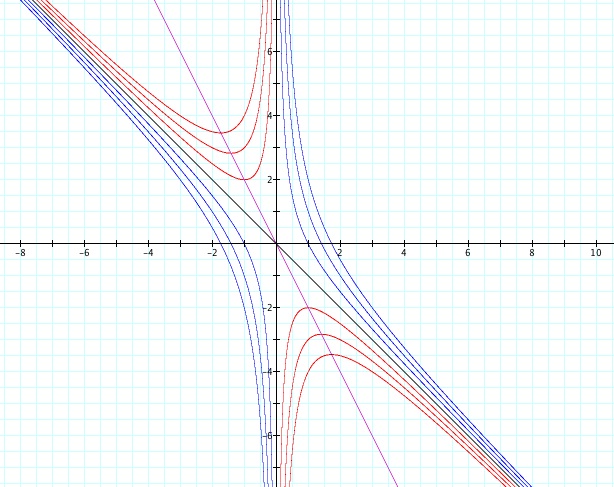
The red hyperbolas are the graphs of ![]() + bx + 1 = 0,
+ bx + 1 = 0, ![]() + bx + 2 = 0, and
+ bx + 2 = 0, and ![]() + bx + 3 = 0.
+ bx + 3 = 0. ![]() + bx + 1 = 0 is the red hyperbola closest to the origin, and
+ bx + 1 = 0 is the red hyperbola closest to the origin, and ![]() + bx + 3 = 0 is the red hyperbola furthest from the origin.
+ bx + 3 = 0 is the red hyperbola furthest from the origin.
The blue hyperbolas are the graphs of ![]() + bx - 1 = 0,
+ bx - 1 = 0, ![]() + bx - 2 = 0, and
+ bx - 2 = 0, and ![]() + bx - 3 = 0.
+ bx - 3 = 0. ![]() + bx - 1 = 0 is the blue hyperbola closest to the origin, and
+ bx - 1 = 0 is the blue hyperbola closest to the origin, and ![]() + bx - 3 = 0 is the blue hyperbola furthest from the origin.
+ bx - 3 = 0 is the blue hyperbola furthest from the origin.
The graph of ![]() + bx + 0 = 0, or
+ bx + 0 = 0, or ![]() + bx = 0 is actually the union of the lines x = 0, and b = -x (both in black). Interestingly enough, all of the hyperbolas formed from changing the values of c are asymptotic to
+ bx = 0 is actually the union of the lines x = 0, and b = -x (both in black). Interestingly enough, all of the hyperbolas formed from changing the values of c are asymptotic to ![]() + bx + 0 = 0.
+ bx + 0 = 0.
First, we will focus on the hyperbolas. In the case of the red hyperbolas, we see that as we increase the value of c, we also increase the amount of space where no real roots occur. We also see that when b is positive, we always have either two positive roots or two negative roots, or no real roots.
In the case of the blue hyperbolas (which are the hyperbolas with a negative value for c), there is always one positive root and one negative root. We also see that as we decrease the value of c, we increase the distance between the hyperbolas, which increases the distance between the positive root and the negative root.
Now we will look at the meaning of the line 2x + b = 0 or b = -2x (shown in purple). This line represents the arithmetic mean of the two roots for any values of b and c where real roots exist. This is important because the x coordinate of the vertex of a parabola always lies on the arithmetic mean of the two roots. For example, we can use the graph to see that when b = 4 and c = 3, the top of the red hyperbolas intersect the line b = 4 at -1 and -3, which means the roots of ![]() + 4x - 3 are -1 and -3. This tells us that the x coordinate of the vertex is -2. A quicker way to do this would have been to simple use the equation b = -2x and plug in 4 for b to find that x = -2 is the location of the vertex of the parabola.
+ 4x - 3 are -1 and -3. This tells us that the x coordinate of the vertex is -2. A quicker way to do this would have been to simple use the equation b = -2x and plug in 4 for b to find that x = -2 is the location of the vertex of the parabola.