

Kristin Ottofy
Assignment 1
Question:
13. Consider two points (3,4) and (-5,-2). For any point (x,y) we can write the distance equations for these as

Explore graphs with these two distance equations. For example,
a. Consider when each is set to a non-zero constant. Circles are graphed.
b. Consider the sum
for various values of S.
c. Consider the product
for various values of P.
Exploration:
CIRCLES
In the following movie, I have animated one of the equations and left the other equation with a radius of 2.

Graphing Calculator 4.0: circles.gcf
Here is an applet the demonstrates the two circle radii moving at the same time: circles_move.gsp
The red equation's radius animates from 0 to 14. We can see that the two circles either have 0 intersections, 1 intersection, or 2 intersections.
These distance formulas are simply measuring the distance of the radii.
Here is an example of a tangent line that forms when we have two circles that intersect at 1 point:
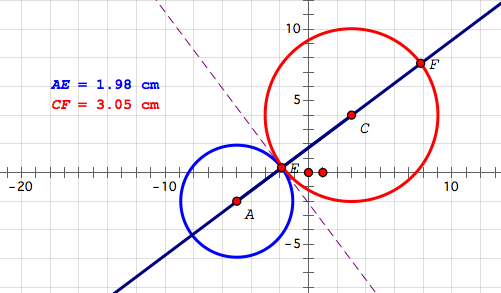
When will that tangent line be equidistant between the two circle centers?
The total distance between the two centers is

So half of that would be 5. Let's set both of our distances in the given equations to 5.
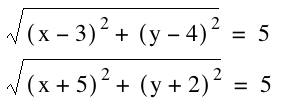
Since they are equal, they can be set to each other. After doing some arithmetic, we are left with 0 = 16x + 12y + 4. This is a linear line. Graphed, it is the blue line in this picture:
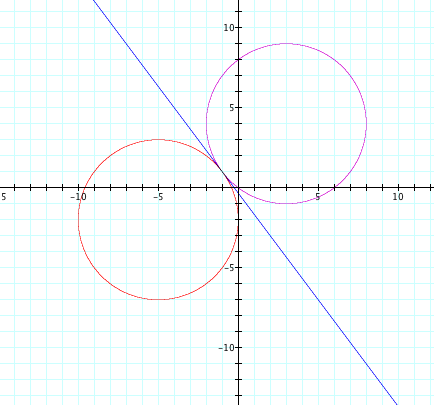
Thus, by finding the point where the two circles will intersect using the halfway point, we can where the two circles' tangent lines would be the same.
ELLIPSES
What happens when I take the sum of the two equations?
![]()
Essentially, we have added the two original equations together. These two equations were equal to d and c respectively. By adding the equations together, we can say that they also equal d+c. Thus, S = d+c.
In the following example, S = 15

Here is a video of the equation where S moves from 0 to 20.
This video shows us that when S<10, no ellipse appears.
An ellipse is the locus of points for which the sum of the distances of two foci is constant. The distance between our two given points was 10.
Here is a movie of the two circle equations and the ellipse equation graphed together where n moves between 0 & 20:

It is easier to see here why the ellipse begins to form after n = 10.
Here is another video of the three equations where I have fixed d and c of the circle equations. Again, n moves between 0 & 20.

So what is about 10?
If we set S to 10, like  ,
,
after doing some more arithmetic, we get  .
.
Here is the graph of this line along with the ellipse equation:
The line  is the line that the centers lie on.
Here is a video where I have set S to reflect a change in n+5 where n is the distance for one of the circle equations and 5 is the distance for the other circle equation. S reflects d+c in this case.
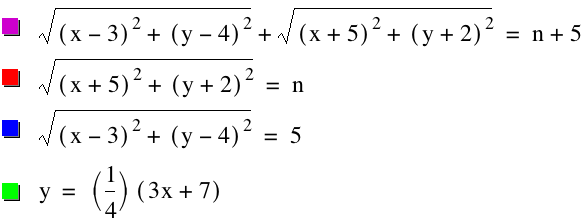
Thus, the circle formulas, the ellipse formula, and the linear equations are all related.
OVALS
What happens when we look at the graph of the product of two distances?
![]()
Here is a video of the equation where n slides between 0 and 200:

It appears that this graph starts with two points at the centers of the circles, expands to circles, those circles merge together to form an oval.
At what point do the two circles merge? By using Graphing Calculator 4.0, it appears that when n = 25, the circles merge.

Here is a video of all of the equations where n goes between 0 and 30:
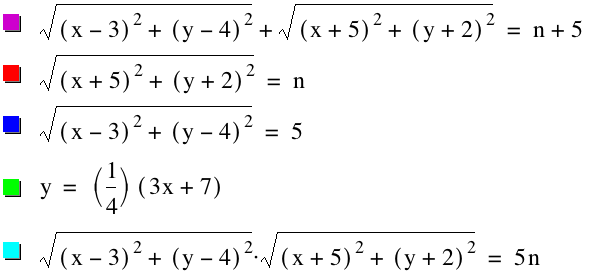
In this scenario, I have allowed P to be 5n, which is d*c. The light blue line, the oval equation, merges when n=5. This is the point where the ellipse begins to form and the circles intersect.