
Kristin Ottofy
Assignment 12
1. Construct a graph of any function y = f(x) by generating a table of values with the x values in one column and the y values in another.
A good tool to use for this is GeoGebra which can be found at:
http://www.geogebra.org/cms/en/download
This is what it will look like in the Spreadsheet view with our x-values placed under the A column and our y-values placed under the B column.
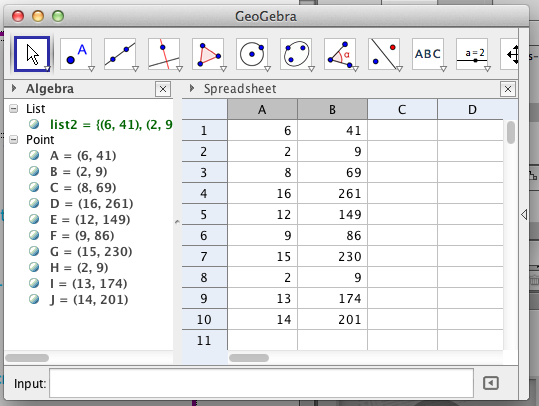
Geogebra will create our equation for us.
If we select the data points like this:
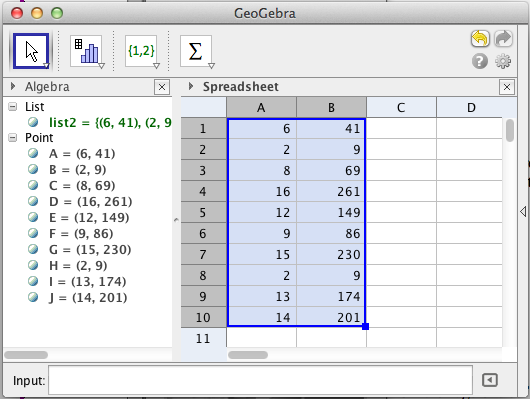
Then, we can click on the icon containing the bar graph, and select "Two Variable Regression Analysis". It will pop up a screen that looks like this:
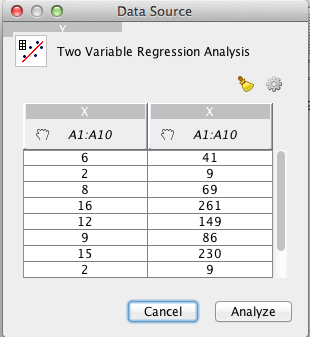
This is confirming which values we are using for our x and y values. This is correct, so we can select "Analyze". Now GeoGebra produces a graph that looks like this:
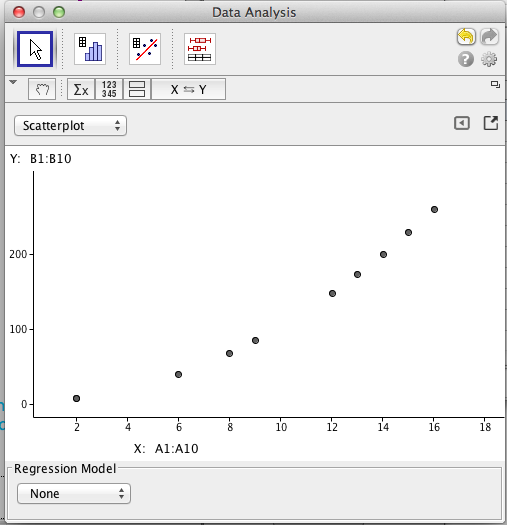
We can change the various Regression Models to evaluate linear, log, polynomial, power, exponential, growth, sin, and logistic equations. For this particular data set, we want to use Polynomial.
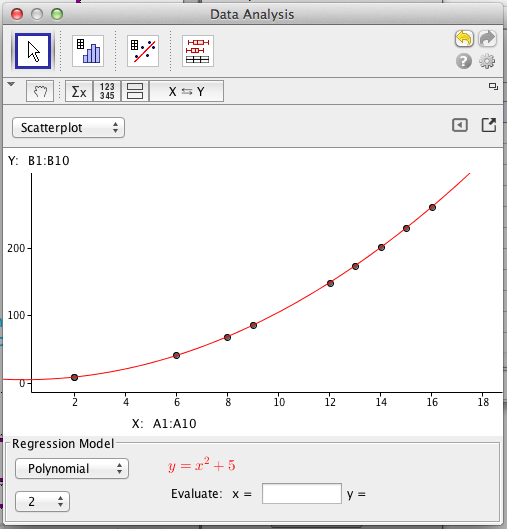
GeoGebra asks us how many degrees we would like to look for in the drop down menu with a 2 in it. This was preselected and correct for our model. GeoGebra provides us with the equation y = x^2 + 5 and even lets us evaluate y values for inputted x values.
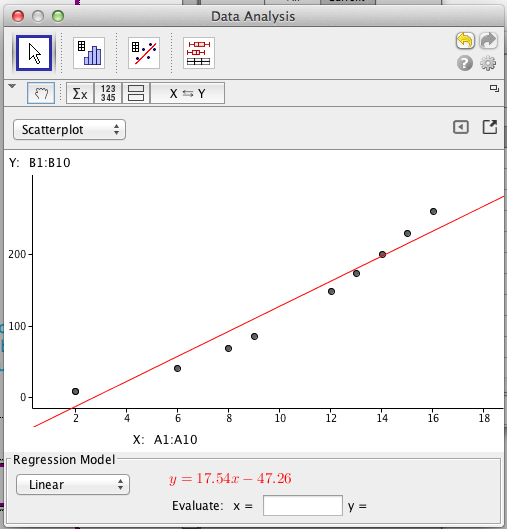
If we wanted to find a line of best fit instead, we can select Linear from the drop down menu and GeoGebra will create this:
Geogebra can also generate graphs given the equation, and from there, y values can be evaluated based on inputted x values.