Transformations of the Sinusoidal Graph
By: Lacy Gainey
We are going to examine the graphs of y = a sin(bx + c) for different values of a, b, and c and explore the impact of each of these parameters.
Before I have students examine transformations of the sinusoidal graph, I will have them examine transformations of the function
for a review.
Review: Graph the following functions and record your observations for each.
For this exploration I would recommend that students use some sort of graphing calculator software. I will be using Graphing Calculator 4.0 software. Students can use graphing calculators, but these transformations are much easier to see on a computer screen. Function Flyer is a free applet from Shodor that students could use as well. This applet is available at http://www.shodor.org/interactivate/activities/FunctionFlyer/
In addition, this applet is called Math Flyer in the App Store and is available for $0.99. A teacher could potentially have their students complete this exploration using their smart phones.
We want to examine the graphs of y = a sin(bx + c) and the impact of the parameters a, b, and c.
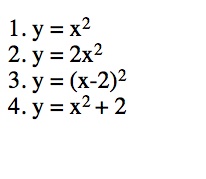
At this point, students should know what the graph of y = sin(x) looks like.
Lets explore Parameter a. y = a sin(x)
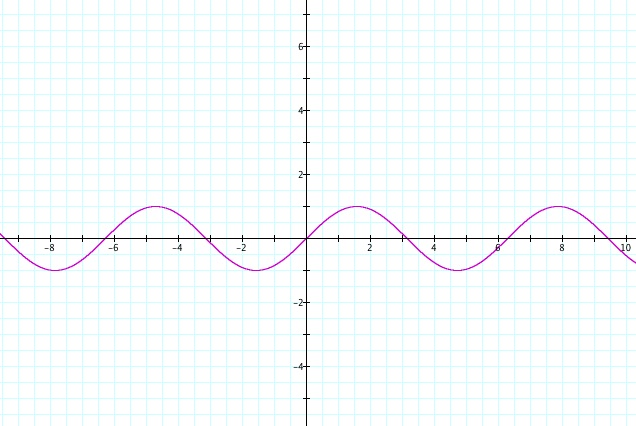
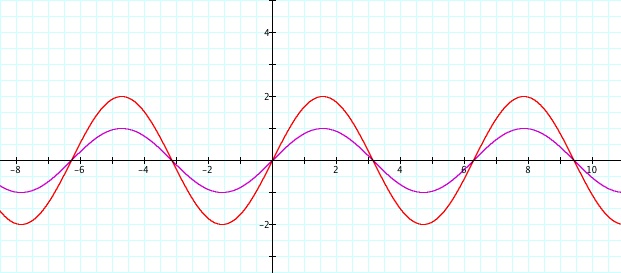
Have students predict what they think the graphs of y = 2 sin(x) and y = ½ sin(x) will look like.The purple curve is the sine graph.
The red curve is the transformation.
y = 2 sin(x)
y = ½ sin(x)
Notice that the minimum and maximum values of the function have increased from -1 and 1 to -2 and 2.
Notice that the minimum and maximum values of the function have decreased from -1 and 1 to -½ to ½.
These graphs represent changes in the amplitude.The absolute value of Parameter a represents the amplitude of the graph.
= Amplitude
For further exploration, have students explore transformations when a < 0.
Lets explore Parameter b. y = sin(bx)
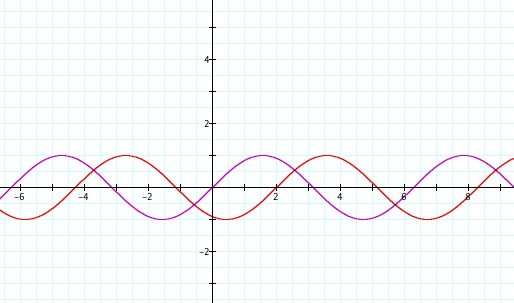
Have students predict what they think the graphs of y = sin(2x) and y = sin(½x) will look like.
From our knowledge of the unit circle, we know the period of y = sin(x) is 2π. The sine function starts repeating itself every 2π units. So it completes one cycle from 0 to 2π, another from 2π to 4π, etc.
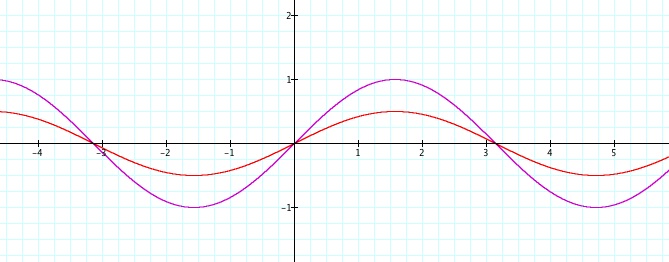
y = sin(2x)
The graph of y = sin(2x) looks like it has been squeezed from the sides like a spring.
We cane see that y= sin(2x) completes two cycles in the interval 0 to 2π instead of one.
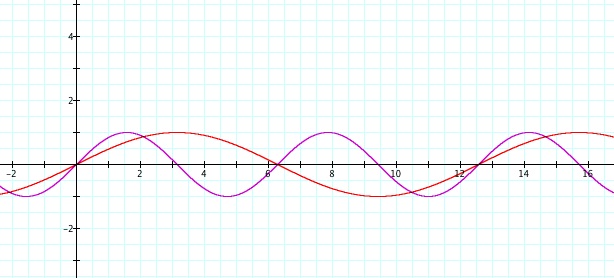
y = sin(½x)
The graph of y = sin(½x) looks like it has been stretched from the sides.
We can see that y = sin(½x) completes half a cycle in the interval 0 to 2π instead of one.
Parameter b deals with period of the sine curve. So, the period of the sine curve is (2π/b)
In the animation above, notice that as the value of b increases from 0 to 5, the graph is being squeezed together, and the period of the sine curve is decreasing.
In the animation above, notice that as the value of b decreases from 0 to -5, the graph is being stretched, and the period of the sine curve is increasing.
What happens to the period of the function when b < 0? What do you think the graphs of the function y = sin(5x) and y = sin(-5x) will look like?
Lets explore Parameter c. y = sin(x + c)
Have students predict what they think the graphs of y = sin(x + 2) and y = sin(x - 2) will look like.y = sin(x + 2)
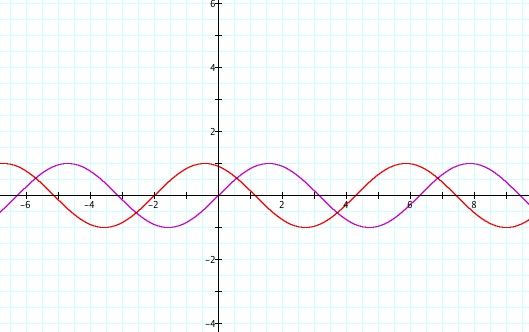
y = sin(x - 2)
Notice that in the graph of y = sin(x + 2) the sine curve has been translated to the left two units.In the graph of y = sin(x - 2) the sine curve has translated to the right two units.
These translations are often referred to as horizontal or phase shifts.
Parameter c represents a phase shift (also called midline shifts).
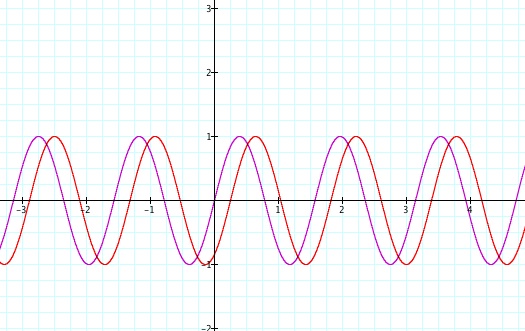
Now, lets graph y = 3 sin(4x -1). We will have to perform an amplitude and period change, in addition to a phase shift.
I find it easier to do the period change first, but there is not a specific order these transformations have to be performed in.
b = 4, so the period of the function is (2π/4) = (1/2π). y = sin(4x)
Now, lets take the graph above and perform a phase shift.c = -1, so the graph has shifted to the right 1. y = sin(4x -1)
Lastly, lets take into account the change in ampliude.
a = 3, so the minimum and maximum values are -3 and 3. y = 3 sin(4x -1)
Hence, we have graphed y = 3 sin(4x -1).
For further exploration, have your students go a step further and predict the impact of Parameter d in the graph of y = a sin(bx + c) + d
Click here to return to Lacy's homepage