
Exploration #1
Graphing Explorations
By Annie Sun
Let's look at the following equations and their graphs:
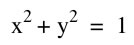
This is the unit circle with the origin at (0,0) and a radius of 1
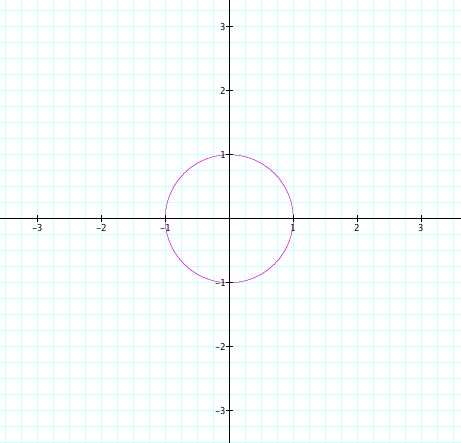
We begin to notice a difference in graphs for 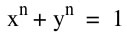 when n is odd and when n is even.
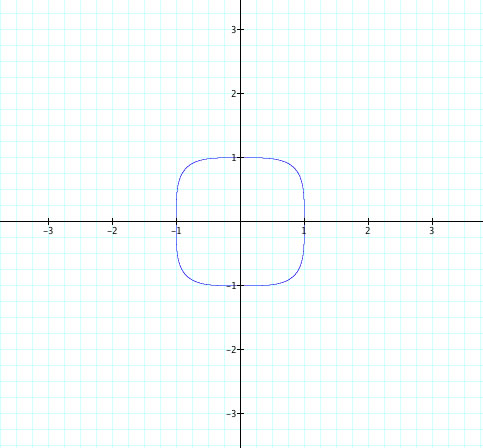
When n is odd...
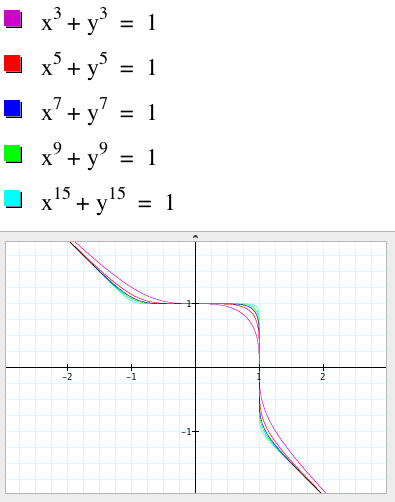
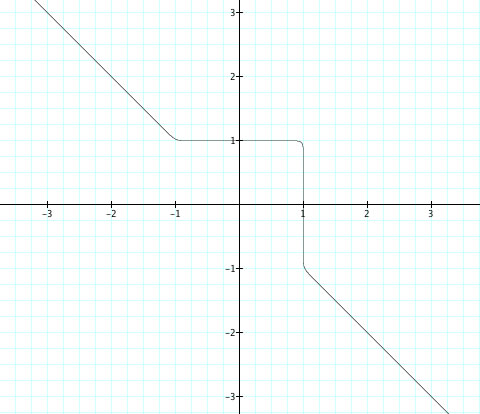
Notice that the graph begins as a curve and becomes more angular. It also look like the line y = x is a diagonal asympotote.
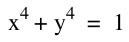
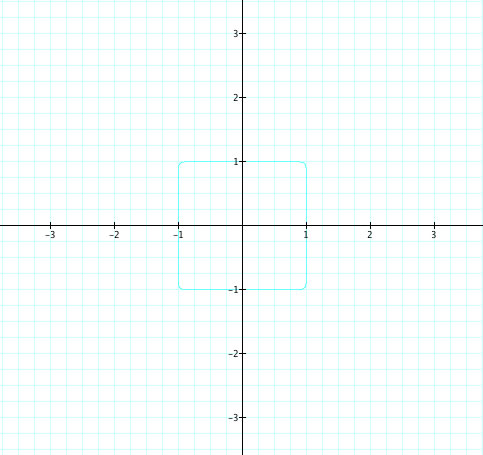
When n is even...
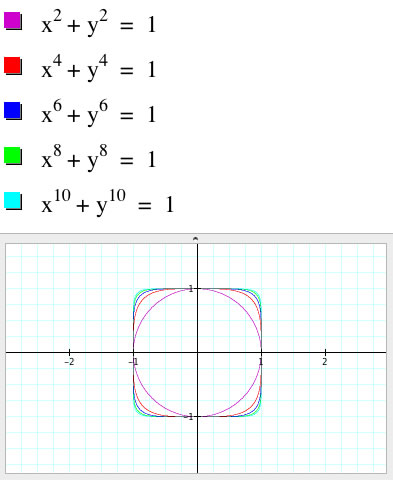
Notice as n increases the graph also begins as the unit circle and then becomes to look like a square (although the corners are still slightly rounded)
So, what do we expect the graph of 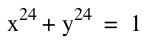 to look like from the pattern of graphs above?
Check your answer
How about 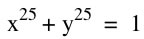 ?
?
Check your answer
We have looked at the graphs of when n are odd and even whole numbers.
Now what if we make the n values negative?
.
.
.
.
.
.
.
.
.
.
Here are some graphs of negative even n values
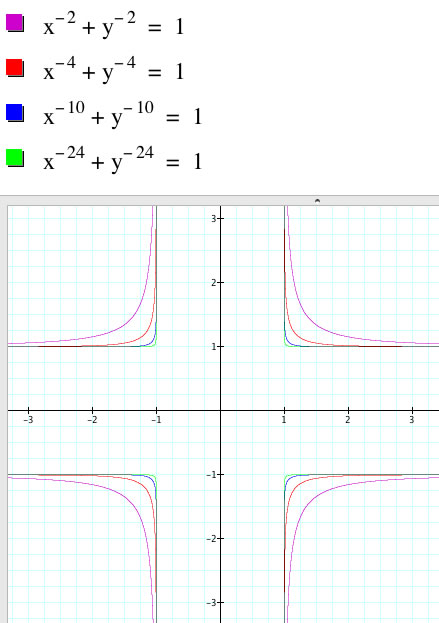
Notice they seem to be the outward graphs of the positive n even values. Let's put them together and see what we get...
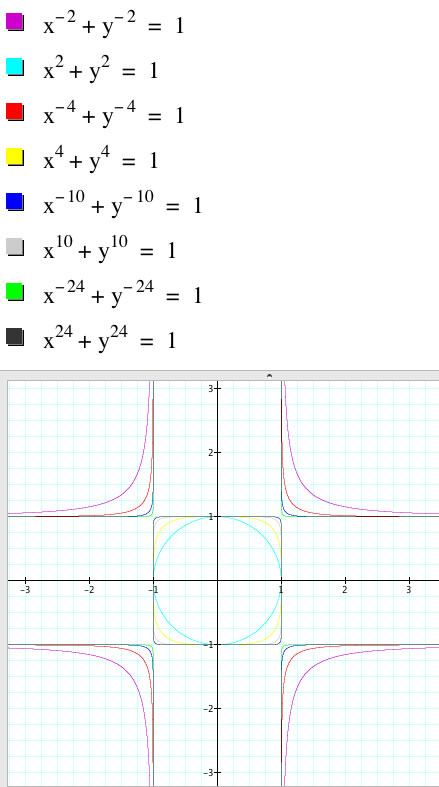
It looks like the corresponding positive and negative n values have the same curvature. It also looks like they have the same asymptotes at y = 1, y = -1, x = 1, and x = -1.
There are still many more values of n that we could use and graphs that can be compared, but to keep it simple, I have only displayed integer values of n. The conclusion that can be made from the equations and graphs above, is that as n approaches infinity in either direction, the graphs get closer to the aymptotes.