
Courrey J.
Alexander
Examine graphs of
y = a sin(bx + c)
for different values of a, b, and c.
- The first thing I did was graphed the equation by varying a and keeping b and c constant at 1.
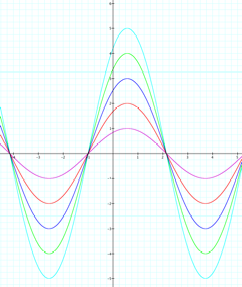
- I have observed that as b and c remain constant at 1 and a increases by +1, the amplitude of the sine curve increases by +1.
- a=amplitude of the sine curve
- Naturally, if a=amplitude of the sine curve, then I would still expect for the amplitude to increase by +1 if the value of a is negative. The only change I expect to see is that the sine curve will be reflected across the x-axis.

§ I have investigated the amplitude of the sine curve with both positive and negative integers while both b and c remain constant at 1. I would like to know if I would get the same results for positive and negative decimals. I assume that it would only make the curves closer to each other in proximity. I will create a graph for -0.5£a£-0.1.

§ Now that I have investigated the behavior of a with both positive and negative integers and decimals, I would like to see the behavior of the graph when a and c are held constant at 1 as b varies from -10 to 10.
§ The graph shows that as the value of b approaches 0 from both sides, the sine curve behaves like a coil that expands and contracts. The period 2P/n has the following values:

§ The value of b apparently has something to do with the displacement of the curve (movement from left to right). I will investigate further with b, but first, I will investigate the behavior of c in (-10,10) as a and b are held constant at 1.
§ This graph shows that as c approaches 0 from both sides, the sine curve behaves like a wave going from left to right. Approaching 0 from the right causes the curve to shift to the right. Approaching 0 from the left, of course, causes the curve to shift to the left. The value of c apparently something to do with the displacement of the curve as well.
§ Now that I have investigated the behavior of a, b, and c one at a time as the other two remained constant at 0, I would like to see the graph as all three vary from -5 to 5.
§ As
a, b, and c vary, the sine curve behaves similarly to the graph
when b varies. As I stated earlier, variations in both
b and c seemed to have affected the displacement of the sine
curve. This is because the
displacement, or phase shift, is equal to ![]() . The
value of c alone affects the
phase angle for the sine curve y=a sin (bx+c).
. The
value of c alone affects the
phase angle for the sine curve y=a sin (bx+c).
§ If
the displacement, or phase shift, has a negative value, then I need to move the
sine graph to the left of its normal position (y=sin x) by ![]() .
.

§ Of course, if the phase shift has a positive value, then I need to move the sine graph to the right.