Although few people know it by name, nearly everyone can recognize a lemniscate. This is because a lemniscate is the mathematical jargon for the figure eight.

During this assignment we will be exploring graphs that lead to the familiar figure eight shape. Then we will explore various characteristics of the lemniscate.
Begin by considering the two points (3,4) and (-5,-2). Let's think about the distance from these two points to all other points. These distances can be expressed, respectively, using the distance formula:
distance_1=![]()
distance_2=![]()
To begin this problem consider what happens when these formulas are set equal to a non-zero constant. In the first graph distance_1 is being set equal to -5, 1, 5, and 10.

Notice that the light blue graph, when distance_1 is set equal to -5, does not show up at all. The range of this graph is all real numbers greater than zero. The graphs are all circles centered at (3, 4) with radius equal to the value to which distance_1 is set equal.
Now set distance_2 equal to -5, 1, 5, and 10.

Observe we get the same type of graph for distance_2 that we got for distance_1. The only difference is that the circles resulting from distance_2 are centered at (-5, -2).
Now let's consider the graphs of the sum of distance_1 and distance_2 set equal to various non-zero constants.
From the previous work done we know that neither
distance_1 nor distance_2 will ever produce negative values, therefore
their sum certainly will not attain a negative value either. This
helps us determine which values might be useful for understanding
the behavior of the graph in question. Start of by setting ![]() +
+ ![]() equal to 0, 5, 10, 15 and 20.
equal to 0, 5, 10, 15 and 20.

It appears that the sum of the distance formulas have a more limited range than the range of the individual distance graphs. The sum seems to have a range of numbers greater than or equal to 10 with each graph taking the form of an ellipse. This makes sense because the sum will be the smallest when one of the square roots is equal to 0 which happens at (-5, -2) and at (3, 4). Both of these points result in a sum value of 10. To make sure that 10 is the bottom of the range set the sum equal to 9.9, 10 and 10.1

Since setting the sum equal to 9.9 does not yield a graph we should feel confident that indeed 10 is the bottom of the range for the sum of these two distance formulas.
After exploring the graph resulting in adding
the two distance formulas it is only natural to see what kind
of graphs result from multiplying distance_1 and distance_2. Using
similar reasoning as in b) we know that the product will not attain
any negative values. Therefore we will begin by setting ![]() *
*![]() equal to 0, 5, 10, 15 and 20.
equal to 0, 5, 10, 15 and 20.

What we see is that for each value that the
product is set equal to produces two ellipses which seem to be
growing as the product value gets larger. We might expect that
if the product is set equal to a large enough value the the ellipses
will either merge or begin to overlap. Set ![]() *
*![]() equal to 10, 20, 30 and 40.
equal to 10, 20, 30 and 40.

Between when the product is set equal to 20 and 30 something important happens. The graph goes from being to disjoint ellipses to a single shape. Let's find out what happens when the product is set equal to 21, 23, 25, 27 and 29. These numbers are choosen because they lie in our values of interest and none of them have been graphed yet so we will not be getting any redundant information.

It appears that when the product is set equal to 25 the two ellipses merge to form one shape. To confirm this guess set the product equal to 24.9, 25 and 25.1.

This graph confirms that ![]() *
*![]() =25 is a figure-eight, otherwise known as
a lemniscate.
=25 is a figure-eight, otherwise known as
a lemniscate.

As it stands the equation for a lemniscate is quite cumbersome so let's do a series of algebraic simplifications to get it into a nicer format:
![]()
Squaring both sides we get
![]()
Expading out leads to
![]()
Convenient choices for moving terms to the
other side of the equal signs gives ![]()
Then a final step in simplification gives the very nice equation
![]()
This form leads us to a very nice generalization
about lemniscates. If the foci of the lemniscate are at (-a, 0)
and (a, 0) then the cartesian equation will always take the form
![]() . Let's explore what the graph
looks like with different values of a. Notice that since a is
being squared the graph of a=2 and a=-2 will be the same. Therefore,
we will only explore positive values of a. Below are the graphs
when a is set equal to 0.5, 1, 2, 3 and 4.
. Let's explore what the graph
looks like with different values of a. Notice that since a is
being squared the graph of a=2 and a=-2 will be the same. Therefore,
we will only explore positive values of a. Below are the graphs
when a is set equal to 0.5, 1, 2, 3 and 4.

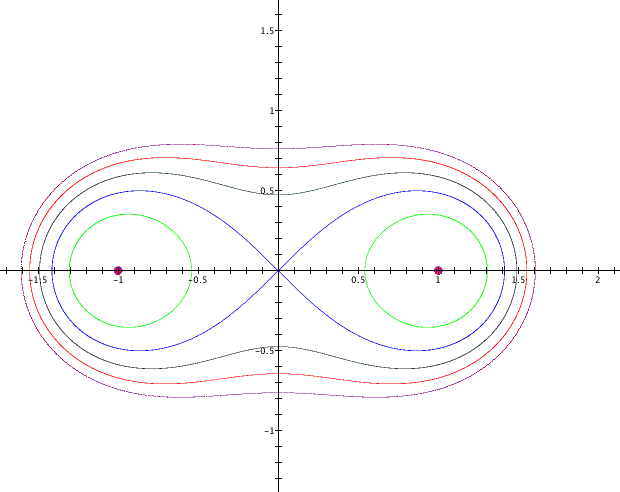
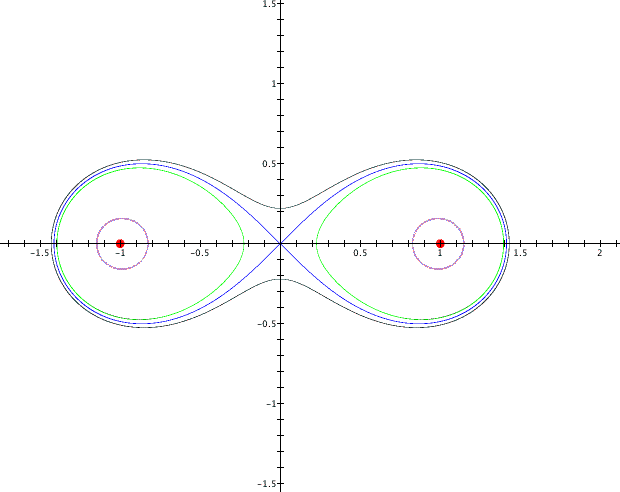
From these graphs we can conclude that as a gets larger so does the lemniscate. The value of a does not affect the overall shape of the graph, it is always a figure eight, only how large it appears.
What happens if we decide to add a constant
to the lemniscate equation? In other words, change the general
form to ![]() We already know that changing
the a value makes the figure-eight grow or shrink. Since we are
trying to understand how changing b affects the graph hold a constant
at a=1. The following are the graphs when a=1 and b=-1.5, -1, -0.5, 0, 0.5, 1 and 1.5.
We already know that changing
the a value makes the figure-eight grow or shrink. Since we are
trying to understand how changing b affects the graph hold a constant
at a=1. The following are the graphs when a=1 and b=-1.5, -1, -0.5, 0, 0.5, 1 and 1.5.

Notice that the graph when b=-1.5 does not show up. That begs the questions of how small of a value can b have that will result in a graph. Also notice that when b is less than 0 the graph consists of disjoint ellipses. When b is greater than 0 the graph consists of a simple, meaning it does not cross itself, and closed, meaning the end points come together, curve. To investigate these predicts the following graph is going to be when b=-1.1, -1, -0.9, -.1, 0 and 0.1

The graph verifies each of our predictions. The constant b gives us a notion of how pinched the graph is and the constant a gives us a notion of how large the graph is.
Up until now we have been working in rectangular
coordinates, meaning x and y in the x-y plane. Now we will convert
the equation of a lemniscate into polor coordinates, meaning r
and ![]() .
Often very complex equations
in rectangular coordinates become very simple in polor coordinates.
The way we change cooridinate systems is by substituting x for
.
Often very complex equations
in rectangular coordinates become very simple in polor coordinates.
The way we change cooridinate systems is by substituting x for
![]() and y for
and y for ![]() . By
doing so
. By
doing so ![]() becomes
becomes
![]() which is indeed a much nicer, easier
to handle function. To see more about how we get this equation
and how to work with polar coordinates I invite you to go to another
investigation, Frozen
Figure Eight
which is indeed a much nicer, easier
to handle function. To see more about how we get this equation
and how to work with polar coordinates I invite you to go to another
investigation, Frozen
Figure Eight
Much time has been spent understanding the
basic form of a lemniscate in rectangular coordinates, ![]() .
However, it is clear that there is still much to be understood.
What happens if x is replaced with x+a or y is replaced with y+b.
What if sinx and siny are used instead of x and y?
.
However, it is clear that there is still much to be understood.
What happens if x is replaced with x+a or y is replaced with y+b.
What if sinx and siny are used instead of x and y? ![]() and
and ![]() ? Looking at the polor coordinate
form what if
? Looking at the polor coordinate
form what if ![]() is used instead of
is used instead of ![]() or different
numbers other than 2? These exercises are left to the student
to explore and learn the world of the lemniscate even more intimately
than before.
or different
numbers other than 2? These exercises are left to the student
to explore and learn the world of the lemniscate even more intimately
than before.