
Stephani Eckelkamp
The
Parabola: Friend of Foe?
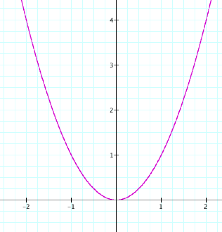
The graph of a parabola
y=x2 has a vertex at (0,0).
The graph is shown below.
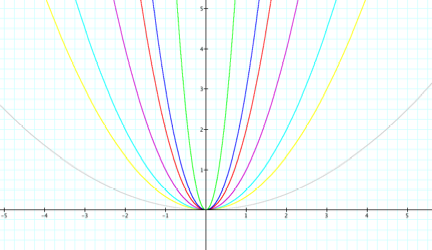
Now, let us look at the
graph y=ax2, where a = 1, 2, 3, 10,
½, 1/3, and 1/10…
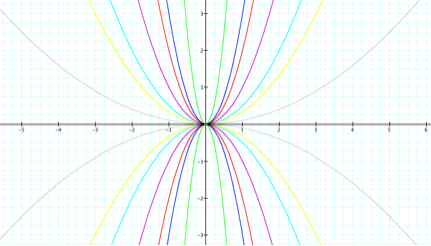
…and when a = -1, -2, -3,
-10, -1/2, -1/3, and -1/10.
 y = 10x2
and y = -10x
y = 10x2
and y = -10x
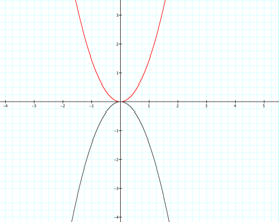
y = 3x2 and y = -3x2
y = 2x2 and y = -2x2
y = x2 and y = -x2
y = ½ x2 and y = -1/2x2
y = 1/3x2 and y = -1/3x2
y = 1/10x2 and y = -1/10x2
We see that by increasing a the parabola is closing in on the y
axis, and as we decrease a the parabola opens wider towards the x axis. By changing a to a negative integer we
get a reflection in the x axis.
Let’s investigate sine functions as the variable a.
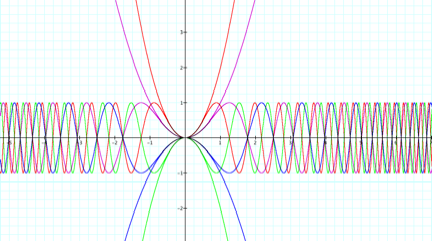 Here we are looking at
the following equations:
Here we are looking at
the following equations:
y = sin x2 and y = x2
y = sin 2x2 and y = 2x2
y = -sin x2 and y = -x2
y = -sin 2x2 and y = -2x2
The
graph of the y = ax2 equation and the y = sin ax2 share
the vertex of (0,0).
 An example of the graph to the
right for all values of n from -10 to -.5 and . 5 to 10. Animated graph
An example of the graph to the
right for all values of n from -10 to -.5 and . 5 to 10. Animated graph
y
= nx2
All graphs
have a vertex of (0,0) because we are only working with the equation y = ax2. From my investigations I can conclude
that a (or n in the graph above) changes the width or narrowness of the
parabola. As we can see with the sin
curves above, the wave lengths are closer together the greater a is.