
Investigation of the
Standard Quadratic Equation
Damarrio Holloway
EMAT 6680
Dr. Jim Wilson
Investigation
1
Part A
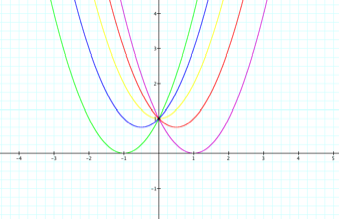
This is the graph of the values of ‘b’ within the set of -2 ³ b £ 2 for the base equation:
The locus is the set of points which satisfies a given
condition, in this case the given condition is the set if points on the x-axis
of particular values where -2 ³ b £ 2 on
the standard quadratic equation ![]() . The locus is a function that contains
all of the vertices for the condition of functions. In this example, the locus equation must pass through -1 and
1 on the x-axis because the quadratic solutions lay within this domain. Also, all the parabolas pass through 1
on the y-axis, which would make the point (0,1) the vertex of the locus equation.
. The locus is a function that contains
all of the vertices for the condition of functions. In this example, the locus equation must pass through -1 and
1 on the x-axis because the quadratic solutions lay within this domain. Also, all the parabolas pass through 1
on the y-axis, which would make the point (0,1) the vertex of the locus equation.
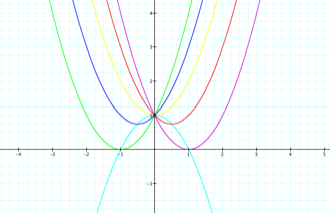
This equation must satisfy all of the requirements, thus the equation must concave downward to have it’s highest point as the vertex and must have -1 and 1 as the roots. Therefore, the equation would be the product of (-x+1) and (-x+1) which equals:
![]() ,
resulting in the graph below where the locus is represented by the aqua-colored
graph.
,
resulting in the graph below where the locus is represented by the aqua-colored
graph.
Part B
Now consider the overlay of graphs where there are fixed ‘b’
and ‘c’ values and we vary the values -2 ³
a £
2, for the equation ![]() where b=1 and c=1.
where b=1 and c=1.
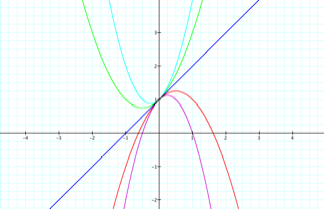
As we vary the values for ‘a’, when it is negative, the
parabola concaves downward, when it is positive, it concaves upward, but when
it is ‘0’, the equation is linear.
As the absolute value of the ‘a’ terms become larger, the vertices get
closer to the y-axis. All of the
quadratic equations have a common tangent line which is the line when a=0.
Part C
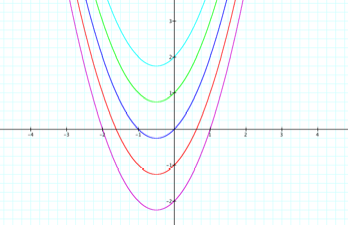
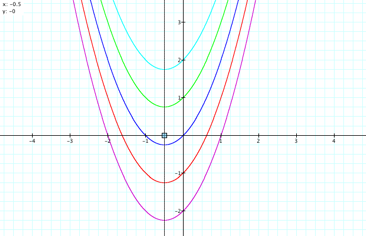
Now lets explore the graphs as we vary ‘c’ and have fixed
constants for ‘a’ and ‘b’ in the quadratic equation ![]() ,
where has a domain of -2 ³ c £ 2. In graph 4, by varying the ‘c’ values, the vertices have a
vertical increase and the shape of the parabolas narrow.
,
where has a domain of -2 ³ c £ 2. In graph 4, by varying the ‘c’ values, the vertices have a
vertical increase and the shape of the parabolas narrow.
 GRAPH
4
GRAPH
4
As the ‘c’ values get larger, the graphs also cross the y-axis at a higher point. The vertices all move along a common line of x=-0.5, which in this case is the locus of vertices.
Return