
Radial Curves
by
Christa Marie Nathe
In this investigation we are going to observe the
following graphs of polar equations
r = 2a sin (k q)
r = 2a cos (k q)
r = 2a sin (k q) + b
r = 2a cos (k q)+ b
Variations of polar equation
r = 2a
sin (k q)
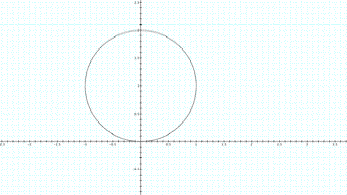
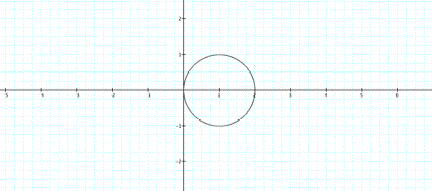
a = 1 ,
k = 1
This equation simply yields a circle with a radius of
1. How does this graph change when the value for a is changed? What is the significance of the k value in this equation?
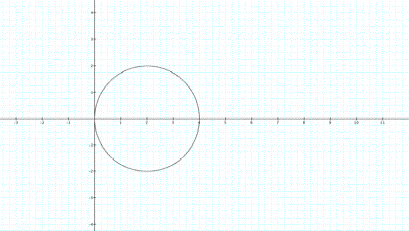
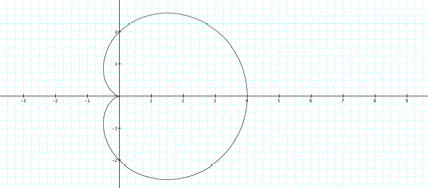
a = 2,
k = 1
When a =
2 the radius of the circle becomes 2 as well, thus the value for a directly affects the radius of the circle.
Next lets look at what happens when k is 2 and the radius remains at 1.
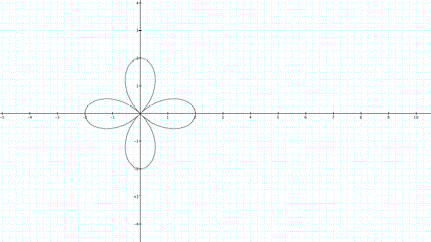
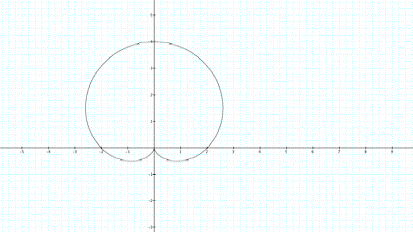
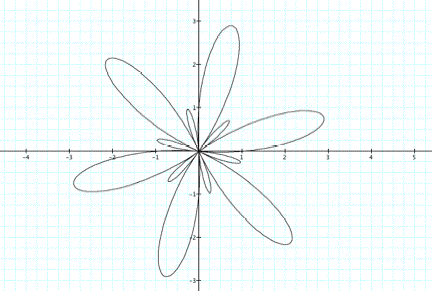
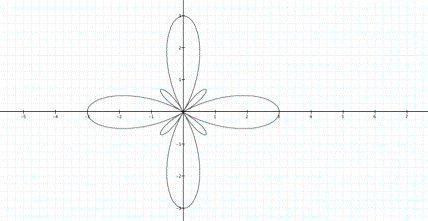
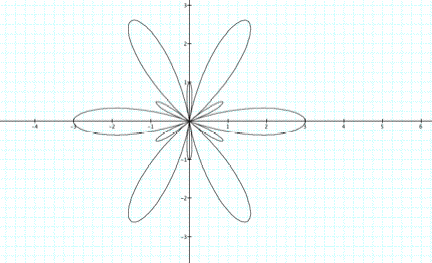
a = 1, k
= 2
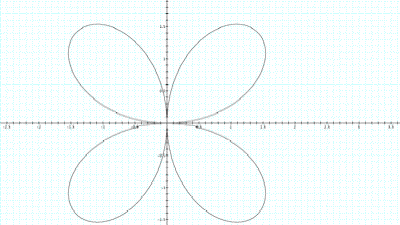
As we can observe from the graph above, the value for k
creates flower pedal like forms in
each of the quadrants of the plane.
What do you think will happen when we keep the value
of a at 1 (for the sake of simplicity) and increase the
value of k to 3?
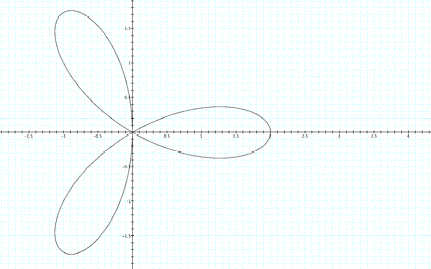
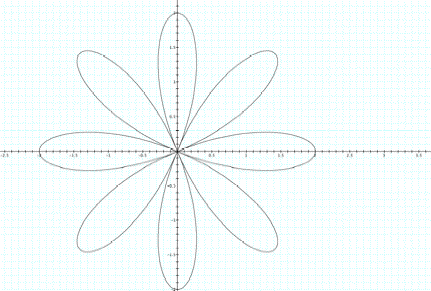
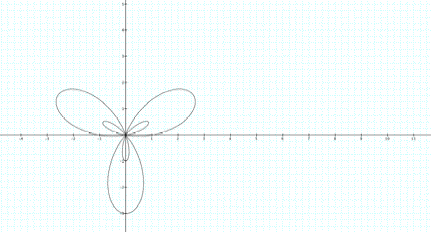
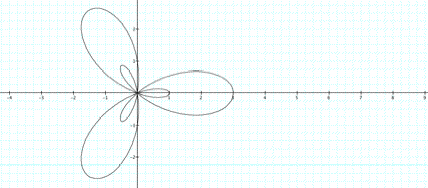
a = 1, k = 3
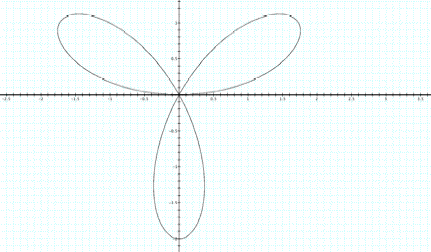
If you suspected this form, you were correct. Here we
have three pedal like forms. As we can see from the pedal that is positioned
between the third and fourth quadrant, the distance from the origin to the
center is 1 which reflects our a value.
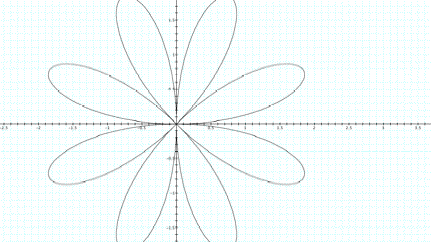
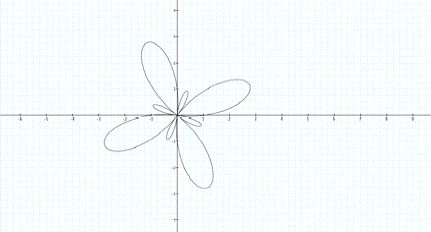
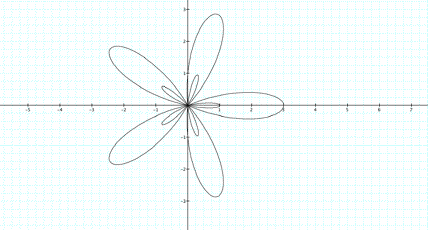
Lets see how the graph where k is 4 looks.
Here, there are two loops, or pedals in each quadrant.
a = 1, k = 4
Variations of polar equation
r = 2a cos (k q)
How is the cosine graph different from the sine graph
in the first equation?
Instead of the circle being centered between the first
and second quadrant, the cosine version of the aforementioned equation is a
circle centered between the first and fourth quadrants.
a = 1, k = 1
We know how the behavior of the graph will change when
a is increased, as we saw in the
sine graph above. For the sake of argument and for visual conformation, lets
change the radius, a, to 2. The change in radius pulls the circle
more to the right, and it does not cross over into the second or third
quadrant.
a = 2, k = 1
How does changing the value of k change the graph? From our experience with the sine equation, we knew that we
would get a graph with four loops connected to each other at the origin.
How is this graph different from the sine graph when k was 2?
Instead of the loops coming out in a diagonal nature
from the origin as in the sine equation, with cosine the pedals are rotated 45
degrees.
a = 1, k = 2
We know that we will get 3 loops when k is 3, but how will the graph be rotated?
a = 1, k = 3
As you can observe, the propeller-looking graph was
spun around the origin 90 degrees if we compare it to the sine graph.
What would you expect the rotation to be for the
cosine graph when k is 4?
a = 1, k = 4
If you anticipated at 45-degree shift, then you were
correct!
Variations of polar equation
r = 2a sin (k q) + b
Below we have the basic form of the graph that we are
going to manipulate by changing the variables in the equation.
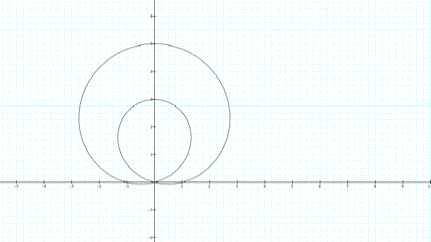
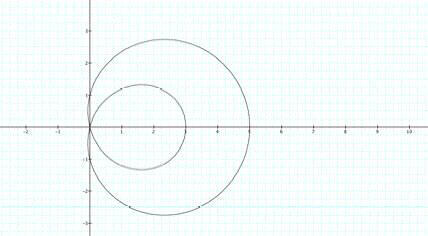
a = 1,
k =1, b = 1
From our previous experience with the variables of a
and k, we know that a changes the radius and the
value of k will yield loops. Lets observe how this knowledge
translates to the manipulation of this particular graphical representation.
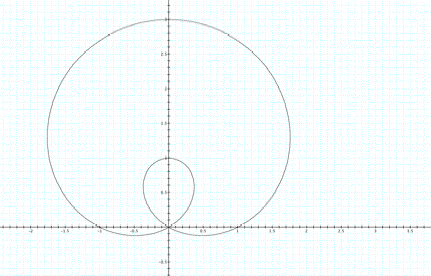
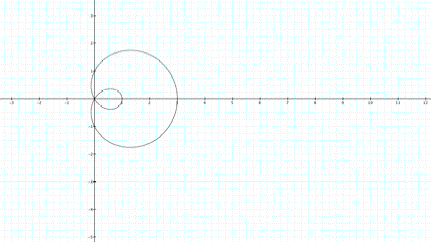
a = 2,
k = 1, b = 1
The internal-smaller loop increased from 1 to 3, and
the external-larger loop increased from 3 to 5.
Lets observe what happens when k is 2, what kind of loops does this particular
equation yield?
a = 1,
k = 2, b = 1
Here we have two small loops in the second and fourth
quadrants and larger loops in the first and third quadrants.
We have a new variable to play with that we did not
have in the first two examples. Lets see what the value of b does to the graph.
a = 1,
k = 1, b = 2
The value of b appears to affect the inner loop.
It depleted the smaller loop.
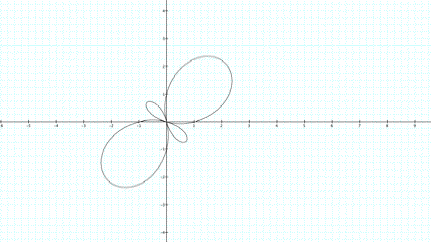
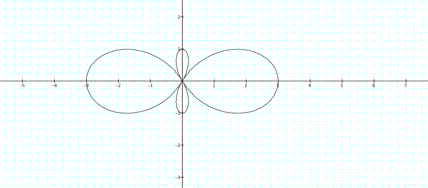
Lets look at the graph when k is 3.
a
= 1, k = 3, b = 1
Great! Just what we had expected. If we compare this
graph to the very first sine equation, it looks very similar, except that we
also have smaller internal loops in addition to the larger loops.
When we have k set to 4, we get four pedals, both large and small, which we expected.
However, did you assume that the smaller loops would be located inside the
larger ones?
a = 1,
k = 4, b = 1
From the graphs that we have explored already for this
particular equation we can make a conjecture about the value of k. If k is even, then the smaller loops will be located
between the larger pedals. However, if k is an odd number the smaller loop will be found in the interior of the
larger pedal(s).
Lets observe a few more cases, just to confirm our
belief.
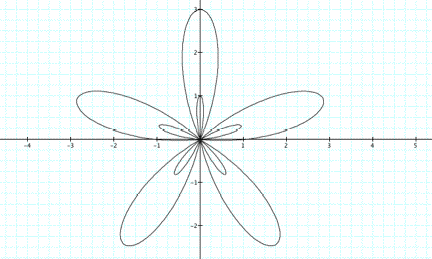
a = 1,
k = 5, b = 1
a = 1, k = 6, b =
1
Variations of polar equation
r = 2a cos (k q)+ b
From our experience with the very first two equations,
we know that graphing the same equation where sine is replaced by cosine will
yield only a rotation in the graphical representation.
Nevertheless, lets graph this equation anyway.
a = 1, k = 1, b = 1
When a is
increased the loops, small and large, swell to the right.
a = 2,
k = 1, b =1
The loops behave in the same manner as in the third
equation when k = 2, however there
is a 45-degree rotation.
a = 1, k = 2, b =
1
Again we have a rotation of the graph and we know from
the previous example that increasing b makes the internal loop evaporates.
a = 1,
k = 1, b = 2
What do you expect the graph to look like when k is 3?
a = 1,
k = 3, b = 1
Exactly! A simple 90-degree rotation.
In the same manner, when k is four, the graph will only be a 45-degree rotation
of the sine equation of the same form.
a = 1,
k = 4, b = 1
Observe the two following graphs where k is five and six. Did you anticipate these rotations?
a = 1,
k = 5, b = 1
a = 1,
k = 6, b = 1
Variations of polar equation
![]()
This polar equation is quite a departure from the
previous equations that we have been investigating.
Lets look at its graphical representation.
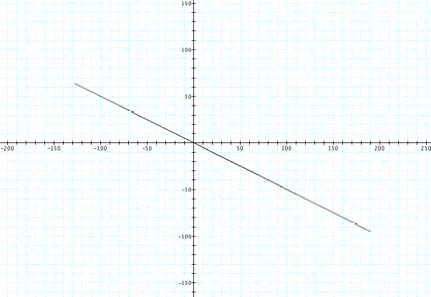
C = 1, a = 1, k =
1, b = 1
Interesting. It is simply a line, a finite line.
Lets change the value of c so that we can observe how the graph changes.
c = 2, a = 1, k =
1, b = 1
When c
becomes two, the length of the segment increases.
How does changing a alter the graph?
Now the line lies in the fourth quadrant primarily. It
is a reversal of direction from when a was one.
c = 1,
a = 2, k = 1, b =
1
How would you expect k to influence the graph?
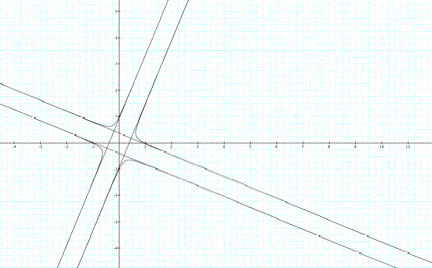
c = 1,
a = 1, k = 2, b =
1
The graph above simply shows that a cross is formed
when k is two and it also
illustrates that line segments that make the cross centered at the origin are
finite and not of equal lengths.
And a closer view of the same graph shows what is happening
at the origin. The graph does not intersect the origin, (0,0) at all.
We will return to altering values of k later, but first lets observe what affect b has on the graph.
When b is
two, the length of the line is shorter with a less dramatic slope than when b
was one.
c = 1,
a = 1, k = 1, b =
2
Recall that when k was two, a square was formed around the origin. What
could you expect when k is three?
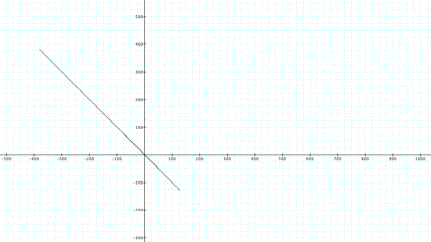
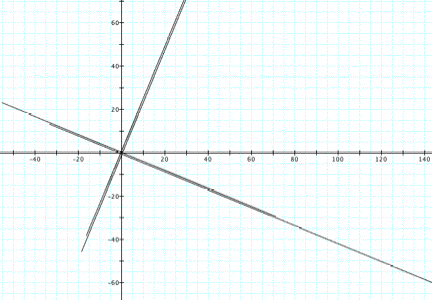
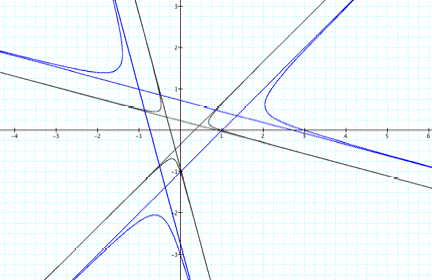
c = 1, a = 1, k = 3, b = 1
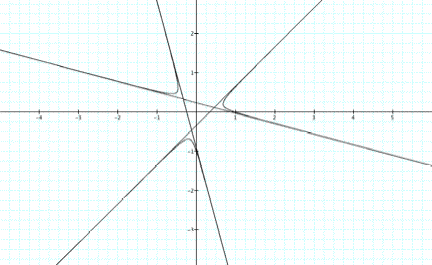
Here we have a triangle centered on the origin with
lines of the triangle extending outward on to the plane.
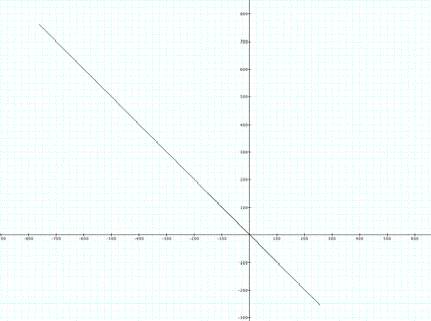
Changing the value of c to 3 and overlaying it against the graph above, we
can compare directly how the graph changes. The blue triangle is larger than
the original black triangle
c = 3, a = 1, k = 3,
b = 1
c = 1,
a = 1, k = 3, b =
1
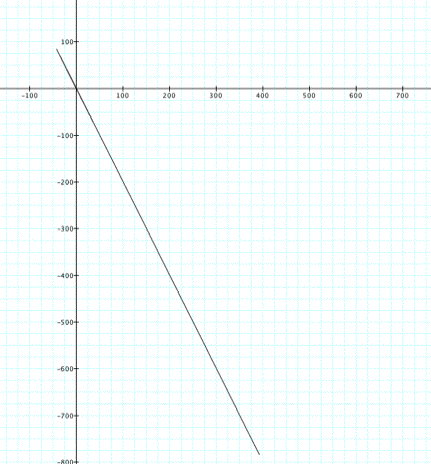
When the value for a is three, how does this compare to the initial graph?
c = 3,
a = 3,
k = 3,
b = 1
c = 1, a = 1, k = 3, b = 1
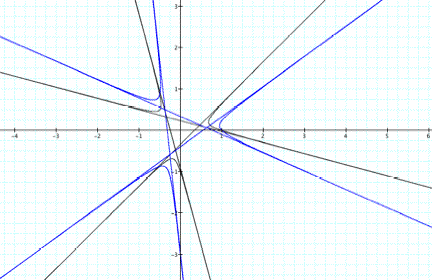
We already observed that changing c increases the size of the triangle, and now a has shifted the graph where part of the graph
intersects the y-axis at (0,-3).
What would you expect the graph to look like when c, a, k, and b
are each three?
c = 3, a = 3, k = 3,
b = 3
c = 1, a = 1, k =
3, b = 1
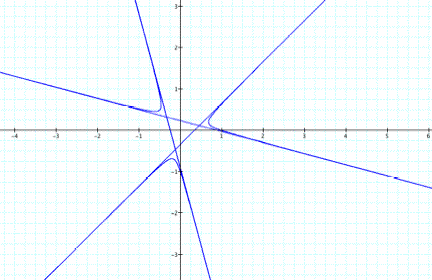
We return to our original graph.
Now lets look at the graph when k is four.
c = 1, a = 1, k = 4, b =1
Here we have a graph of four pipe looking objects that
are centered on the origin.
What would you expect to happen when c is four?
The graph below shows us that the square formed by the
intersection of the pipe-like figures has been dilated. Set to the same scale,
we can observe that this is true.
c = 4, a = 1, k = 4,
b = 1
c = 1, a = 1, k = 4, b = 1
As we observed before, changing a simply shifts the graph slightly. Looking
at the graph, we can confirm this hypothesis.
c = 4, a = 4, k = 4,
b = 1
c = 1, a = 1, k = 4, b = 1
When all of the variables are four, we derive the
initial graph when all each value was one.
c = 4, a = 4, k = 4,
b = 4
c = 1,
a = 1, k = 4, b =
1
This investigation of variations of this set of polar
equations has yielded a better understanding of what affects changes to
particular variables does to the graphical representation of the equations.