
Parametric Explorations of Powers of Some Simple Sinusoidal Functions
Brian Swanagan
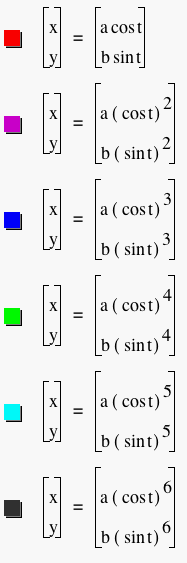
We shall explore varied forms of the parametric equations x = a(cost)^k and y = b(sint)^k for natural number k's. For the moment, we let a = b = 1.
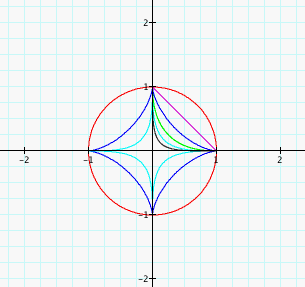
When k = 1, we have a circle. When k = 2, we have a straight segment with a negative slope from (0, 1) to (1, 0). For k > 2, we have that rapidly approaches a 0 y-value as x approaches 1 and a 0 x-value as y approaches 1. We know that when t = 0, pi, or 2*pi, then sin(t) is 0 and cos(t) is 1 or -1. When t = pi/2 or 3*pi/2, then cos(t) is 0 and sin(t) is 1 or -1. All odd powers of -1, 0, and 1 are -1, 0, and 1 respectively (unchanged) and all even powers of -1, 0, and 1 are 1, 0, and 1 respectively (unchanged magnitude and sign is always positive). That is why (1, 0) and (0, 1) are points that exist for all the functions despite the k-value.
For other t-values, |sin(t)| and |cos(t)| are between 0 and 1, exclusively. Furthermore, 1 > |sin(t)| > |sint(t)^2| > |sin(t)^3| > ... > |sin(t)^k| > |sin(t)^(k+1)| > ... > 0. The same goes for cos(t) if you substitute it for sin(t). That is why the curve bends inwards closer to the origin as k grows other than when t = m*pi/2 for integer values of m. As k grows larger, the graph approaches the axes. For odd powers of k, the graph begins to look more like perpendicular bounded axes. For even powers of k, the graph beings to look more like a right angle.
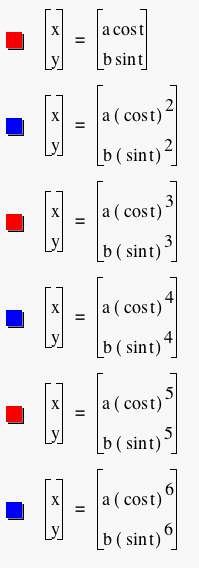
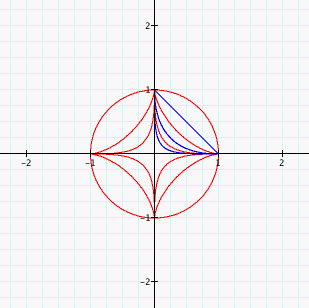
The graph only exists in the first quadrant for even k because a, b > 0 and z^k >= 0 for all z values. If we let a be negative and b be positive, then the graph would reside in the 2nd quadrant. Switching the two causes the graph to be in the fourth quadrant and making both negative puts it in the third quadrant. Varying the sign of a and b, does not affect the graph for odd powers of k but rather the starting and ending locations as the graph is drawn. Below, I change the colors of the odd k-valued functions to red and the even ones to blue to help them stand out better so that we can see the results of the graphs.
It is important to recognize why k=2 causes the graph to be a straight segment. We know that cos(t)^2 + sin(t)^2 = 1. So x = a(cos(t)^2) = a(1 - sin(t)^2) = a(1 - y/b). Then (b/a)x = b - y so finally we have the equation y = -(b/a)x + b, the slope-intercept form for a line. sin(t) and cos(t) only vary between -1 and 1 though so we only end up with part of the line from (0, b) to (a, 0).
Earlier, we simply had a = b = 1. If we let a = b be other positive values, we can simply rescale our coordinate system to get the same graphs we have above. We already discussed the result when a and be vary in sign.
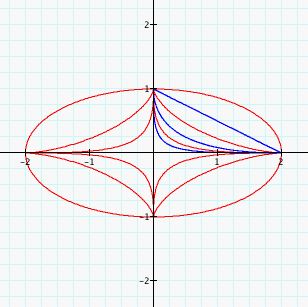
Now, let's look at what happens when |b| > |a| > 0 or |a| > |b| > 0. In the first graph, we let b = 2 and a = 1. We see that the graph becomes wider than it is tall. For k = 1, we now have an ellipse. As our the magnitude of our x-values approach the magnitude of our b-value, the y-value decreases to 0. As our x-values approach 0, the magnitude of our y-values approach the magnitude of a.
In the second graph, we let b = 1/2 and a = 1. We see that the graph is now taller than it is wide. In both graphs, the height from top to bottom remains 2a and the width is always 2b.
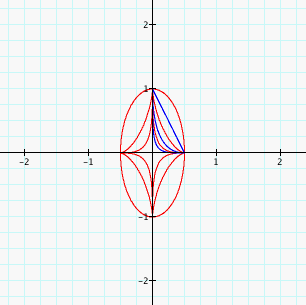
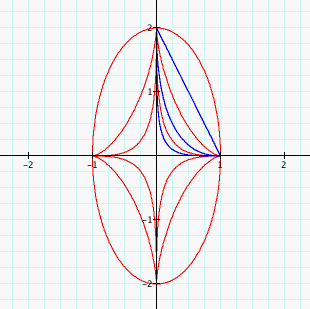
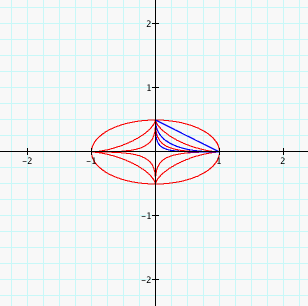
Lastly, we look at what happens when we change a rather than b. The first graph has a and b values of 2 and 1, respectively. The graph is now taller than it is wide. The second graph has a and be values of 1/2 and 1, respectively. The resulting graph is wider than it is tall. Still, the heigh is 2a and the width is 2b.
So, as a grows and shrinks, the height of the graph grows and shrinks respectively. As b grows and shrinks, the width of the graph grows and shrinks respectively. They all reach the values (0, a) when t = pi/2, (0, -a) when t = 3*pi/2, (0, b) when 0 and 2pi, and (0, -b) when t = pi. 0 < |x| < |b| when and only when 0 < |y| < |a|. The graphs are always closer to the origin for t-values that are not a form of m*pi/2 where m is an integer value as k increases in value.