

In this exploration, we want to look at various polar coordinates and investigate the kinds of graphs will see.
Let's start out by investigating the following function:
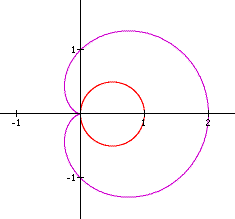
If we let a and b both equal each other and k be some constant integer, we get the following graph:
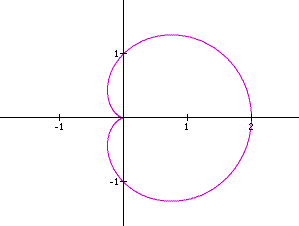
Ok, we see that this gives us the textbook version of the 'n-leaf rose' which is also known as a cardiod. This falls under a special family of graphs called Limacon. We can obtain a cardiod by tracing the path of a point on a circle rolling around the circumference of another circle with the same radius. If we let k be constant and change a and b, we will get the following graphs:

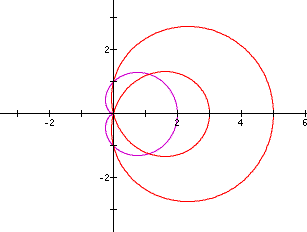

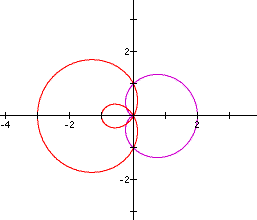
So, we see that when b is less than or equal to 2a, the limacon is convex and when b and a equal, it degenerates to a cardiod. If b is strictly less than a, then the limacon has an inner loop like the graph above.
Now let's change the value of k but keep a and b constant.
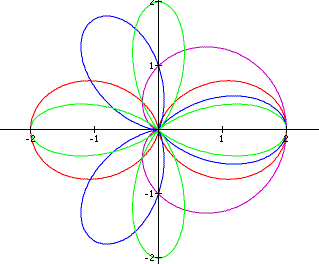
Now, let's look at this with various values of k.
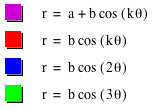
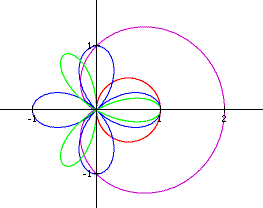
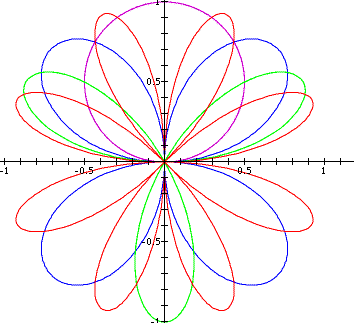
So we see yet another pattern here. If k is an integer, the curve will be rosed shaped with 2k petals if k is even and k petals if k is odd. What will happen if k is an irrational?
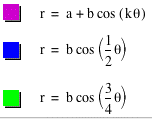
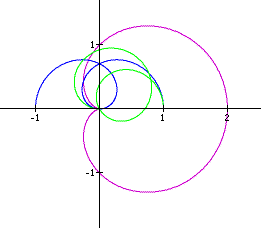
So our results shows us that when k is an irrational number, then it is not closed and has infinite length and when it is rational, it has a finite length and the curve is closed.
Now let's investigate the same function but instead of cosine, lets use sine.
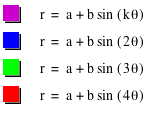
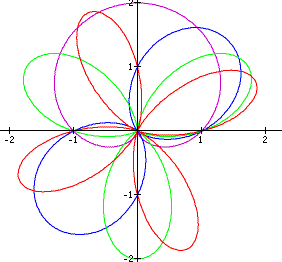
Again we see
that the value of k determines the number of petals and the graph
actually rotates towards the y-axis. We want to compare this to
![]() .
.
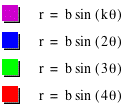
How lovly...ok,
clearly we can see that sine and cosine are identical except for
a rotation of ![]() radians.
radians.