
Try Several graphs of
on the same axes (i.e., use different values of a)
First let's stat what we know by just looking the equation. We know that the graph will be a parabola, meaning that for every two values of x (i.e. 1 and -1 - which are defined as additive inverses - meaning when they are added together you get 0, zero) there is only one value for y. Let's plug a few pairs of additive inverses for x and see what we get for y, just to check our assumption:

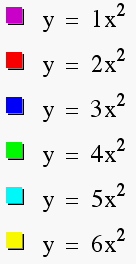
Therefore we have established that each pair of x values, (additive inverses), we have the same y, so we can see that the graph will be symmetrical to the y-axis. Now let's graph the equation only using positive integers for a and see what happens, as a increases by increments of 1 (for the graph we will use 1 to 6 for a).


We can see that we were right in guessing that y would always be positive and that the graph would be a parabola which is symmetrical to the positive y-axis. We also notice that as a increases the graph gets "skinnier", or closer to the y-axis.
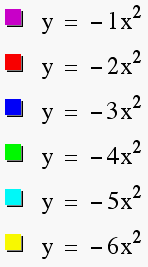
Let's take a look at the same equations above, but make a negative. We can guess that we will have the same result as above (Graph A) with a parabola, but that since the y value will be negative, that our graph will be symmetrical to the negative y-axis.


We can see that in Graph B ,we were right in guessing the y value would always be negative and that the graph would be a parabola symmetrical to the negative y-axis. We also notice that as a decreases (-1 to -2 to -3, etc.) the graph gets "skinnier", or closer to the y-axis, just like Graph A.
We can now conclude from our graphs above that due to the fact
that the equation is of the form ![]() , we
know that if a is positive then it is a parabola
that is along the positive y axis, because
, we
know that if a is positive then it is a parabola
that is along the positive y axis, because ![]() means that y can never be negative, and likewise
if a is a negative value the parabola will be along
the negative y-axis because y will always be negative.
means that y can never be negative, and likewise
if a is a negative value the parabola will be along
the negative y-axis because y will always be negative.
So from what we have discovered about the values of a, looking
at a as a negative value and then as a positive value, we must
assume that at some point the graph switched from a upward parabola
to a downward parabola. Can we find that value?? Let's take a
look at the graph of our equation, ![]() , letting
a (which we have made n in the graph below) vary from -10
to 10, using our graphing program and see first if it is true
that the graph will "flip" over the x-axis at some point.
, letting
a (which we have made n in the graph below) vary from -10
to 10, using our graphing program and see first if it is true
that the graph will "flip" over the x-axis at some point.

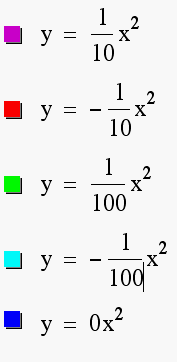
You can see from the graph in motion, that indeed the graph "flips" over the x-axis, when the value of a goes from negative to positive, or vice versa. So now let's make an educated guess that since 0, zero, is the value that seperates positive and negative integers that 0, zero, is also our value at which the graph "flips", (that the x-axis is not included in the solution graph). Let's look at the graph below and see if this is the case......


We do see that as the value of a get's closer and closer
to 0, zero, that the graph get's wider and get's closer to the
x-axis, but never includes the x-axis. Let's refer back to our
original equation and see why this is the case. We know that along
the y-axis that the value for y is 0. So if we plug 0 in for y
in our equation we get, ![]() . We know the only
value that will give us zero on the right hand side,
. We know the only
value that will give us zero on the right hand side, ![]() ,
is if x = 0. So the point (0,0) where x=0 and y=0, which is what
we call the origin, is where the graph "makes the flip"
over the x-axis.
,
is if x = 0. So the point (0,0) where x=0 and y=0, which is what
we call the origin, is where the graph "makes the flip"
over the x-axis.