
Most of us are aware that the quadratic equation
![]() yields the graph of a parabola.
We are going to explore how each of the variables a, b,
and c affect the graph of
yields the graph of a parabola.
We are going to explore how each of the variables a, b,
and c affect the graph of ![]() .
First, let's take a look at the simplest of the quadratic equation
.
First, let's take a look at the simplest of the quadratic equation
![]() , where a = 1, b
= 0, and c = 0. This gives us the quadratic equation
, where a = 1, b
= 0, and c = 0. This gives us the quadratic equation ![]() .
.


As you can see from the graph, ![]() is a parabola, with the vertex at the origin (0,0). Because the
term
is a parabola, with the vertex at the origin (0,0). Because the
term ![]() will always yield a positive result,
the graph is above the x-axis. The graph will continue to increase
to infinity. We can correlate this to the function
will always yield a positive result,
the graph is above the x-axis. The graph will continue to increase
to infinity. We can correlate this to the function ![]() by saying that the domain of the function is all real numbers,
while the range is all positive real numbers. We can also see
that the variables a, b, and c will affect
the graph of the parabola. Let's see how each variable affects
the graph. First, we will change a and leave b and c constant.
Let's look at the graph
by saying that the domain of the function is all real numbers,
while the range is all positive real numbers. We can also see
that the variables a, b, and c will affect
the graph of the parabola. Let's see how each variable affects
the graph. First, we will change a and leave b and c constant.
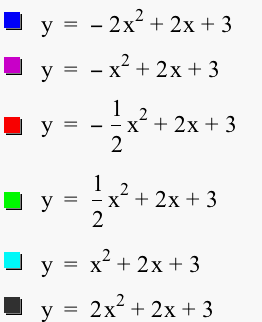
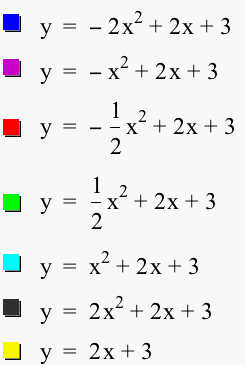
Let's look at the graph ![]() where
a = -2, -1, -1/2, 1/2, 1, and 2, b = 2, and c
= 3.
where
a = -2, -1, -1/2, 1/2, 1, and 2, b = 2, and c
= 3.


As we can see from the graphs, when 0 < |a| < 1 (|a| means absolute value of a), the parabola appears wider. When |a| > 1, the parabola appears thinner. When a is positive, the parabola opens upwards; when a is negative, the parabola opens downward. We can also see from the graphs that they all have a common point (0,3). Associating this with our equations, we notice that this correlates to our c = 3. When x = 0, all of the equations yield y = 3. What happens when a = 0? Let's take a look at the graph in comparison to the 6 graphs above.


As we probably could have guessed, when a
= 0, we no longer have a quadratic equation. Instead, we have
the linear equation y = 2x + 3, in which the graph is a line.
But what do we notice about the line y = 2x + 3? It also has the
point (0,3) in common with the parabolas. As a matter of fact,
the line y = 2x + 3 is tangent to all six parabolas graphed above.
Now, how does changing b affect the graph of the parabola
when a and c are left constant? Let's look at the
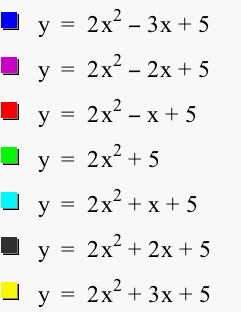
graph ![]() where b = -3, -2, -1, 0,
1, 2, and 3, a = 2, and c = 5.
where b = -3, -2, -1, 0,
1, 2, and 3, a = 2, and c = 5.


As we can see from the graphs, changing b
affects the location of the vertex with respect to the y-axis.
When b = 0, the vertex of the parabola lies on the y-axis.
Changing b does not affect the shape of the parabola (as
changing a did). Making b positive or negative only
reflects the parabola across the y-axis. So, the displacement
of the vertex from the y-axis is caused by the absolute value
of b. Finally, let's look at how changing c affects
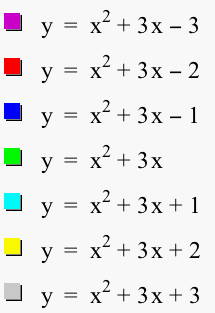
the graph of the parabola. We will look at the graph ![]() where c = -3, -2, -1, 0, 1, 2, and 3, a = 1, and
b = 3.
where c = -3, -2, -1, 0, 1, 2, and 3, a = 1, and
b = 3.


As we can see from the graph, changing c
affects the vertical shift of the graph. When c > 0,
the graph shifts up c units. When c < 0, the
graph shift down c units. Now we have examined how changing
a, b, and c affects the graph ![]() .
To recap, changing a makes the parabola appear "wider"
or thinner". In other words, when |a| > 1 (absolute
value of a), the graph compresses. When 0 < |a|
< 1, the graph stretches. Changing b affects the location
of the vertex with respect to the y-axis. And changing c
affects the vertical shift of the graph.
.
To recap, changing a makes the parabola appear "wider"
or thinner". In other words, when |a| > 1 (absolute
value of a), the graph compresses. When 0 < |a|
< 1, the graph stretches. Changing b affects the location
of the vertex with respect to the y-axis. And changing c
affects the vertical shift of the graph.