
Erik D. Jacobson
Erik D. Jacobson
Tree Growth | Home
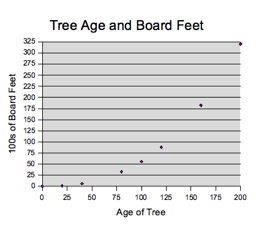
The first task of this
exploration was to plot the given data.
From the figure below, it looked like the curve is quadratic, cubic (or perhaps
exponential). It seemed plausible
that the number of board feet would grow in a quadratic manner (assuming a
fixed height was usable lumber) since the diameter of the tree would grow
linearly with respect to time, so the area of the cross-section would grow
quadratically with respect to time.
However, this model doesn't seem to take into account the growth in the
tree's height, so it may be a case of a cubic (or exponential) relationship
approximated by a quadratic function.
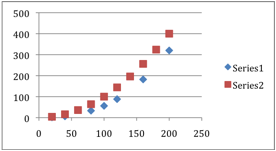
The first model was just 10% of the tree's age, squared. The error for this model is quite high, and the discrepancy between the model and the data is quite obvious when they are plotted together.
|
Age of
Tree |
100s of Board Feet |
Model |
Squared
Error |
|
|
|
(x*0.1)^2 |
|
|
20 |
1 |
4 |
9 |
|
40 |
6 |
16 |
100 |
|
60 |
|
36 |
|
|
80 |
33 |
64 |
961 |
|
100 |
56 |
100 |
1936 |
|
120 |
88 |
144 |
3136 |
|
140 |
|
196 |
|
|
160 |
182 |
256 |
5476 |
|
180 |
|
324 |
|
|
200 |
320 |
400 |
6400 |
|
|
|
TOTAL: |
18018 |
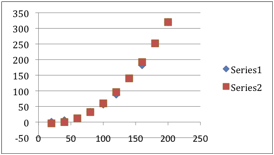
Subtracting 40% of the tree's age improved the model by a significant amount, but my goal was to get the total squared error under 100.
|
Age of
Tree |
100s of Board Feet |
Model |
Squared
Error |
|
|
|
(x*0.1)^2-(x*0.4) |
|
|
20 |
1 |
-4 |
25 |
|
40 |
6 |
0 |
36 |
|
60 |
|
12 |
|
|
80 |
33 |
32 |
1 |
|
100 |
56 |
60 |
16 |
|
120 |
88 |
96 |
64 |
|
140 |
|
140 |
|
|
160 |
182 |
192 |
100 |
|
180 |
|
252 |
|
|
200 |
320 |
320 |
0 |
|
|
|
TOTAL: |
242 |
|
|
|
|
|
The next improvement of the model was to add a linear term. I noticed that many of the expected values were below what was observed.
|
Age of Tree |
100s of Board Feet |
Model |
Squared Error |
|
|
|
(x*0.1)^2-(x*0.5)+10 |
|
|
20 |
1 |
4 |
9 |
|
40 |
6 |
6 |
0 |
|
60 |
|
16 |
|
|
80 |
33 |
34 |
1 |
|
100 |
56 |
60 |
16 |
|
120 |
88 |
94 |
36 |
|
140 |
|
136 |
|
|
160 |
182 |
186 |
16 |
|
180 |
|
244 |
|
|
200 |
320 |
310 |
100 |
|
|
|
TOTAL: |
178 |
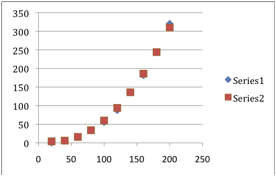
Although the model was significantly improved, I thought I could do better. The last step was to fine tune each parameter by trial and error, beginning with the coefficient of the quadratic term and finishing with the linear term.
|
Age
of Tree |
100s of Board Feet |
Model |
Squared
Error |
|
|
|
(x*0.104)^2-(x*0.62)+9.8 |
|
|
20 |
1 |
1.7264 |
0.52765696 |
|
40 |
6 |
2.3056 |
13.64859136 |
|
60 |
|
11.5376 |
|
|
80 |
33 |
29.4224 |
12.79922176 |
|
100 |
56 |
55.96 |
0.0016 |
|
120 |
88 |
91.1504 |
9.92502016 |
|
140 |
|
134.9936 |
|
|
160 |
182 |
187.4896 |
30.13570816 |
|
180 |
|
248.6384 |
|
|
200 |
320 |
318.44 |
2.4336 |
|
|
|
TOTAL: |
69.4713984 |

The last model achieved my goal, having a total squared error of less than 100. Since the model's purpose is to provide approximations of the number of board feet at 60, 140, and 180 years I would argue that the model's estimates for each of these may be revised. The model's values are below those observed at 40 and 80 years and so it is sensible to expect its value at 60 years will be also be low. Similarly, the model's values for 120 and 160 years are both high, so it is likely that its value for 140 years will likewise be high. Since the model's value is low for 200 years, its prediction for 180 may be high or low of the actual value.