

Assignment X: Lissajous Curves
by
Rui Kang
In this investigation, we look at a class of parametric curves called the Lissajous Curves.
Consider the parametric equations:
 (for 0<= t <=50)

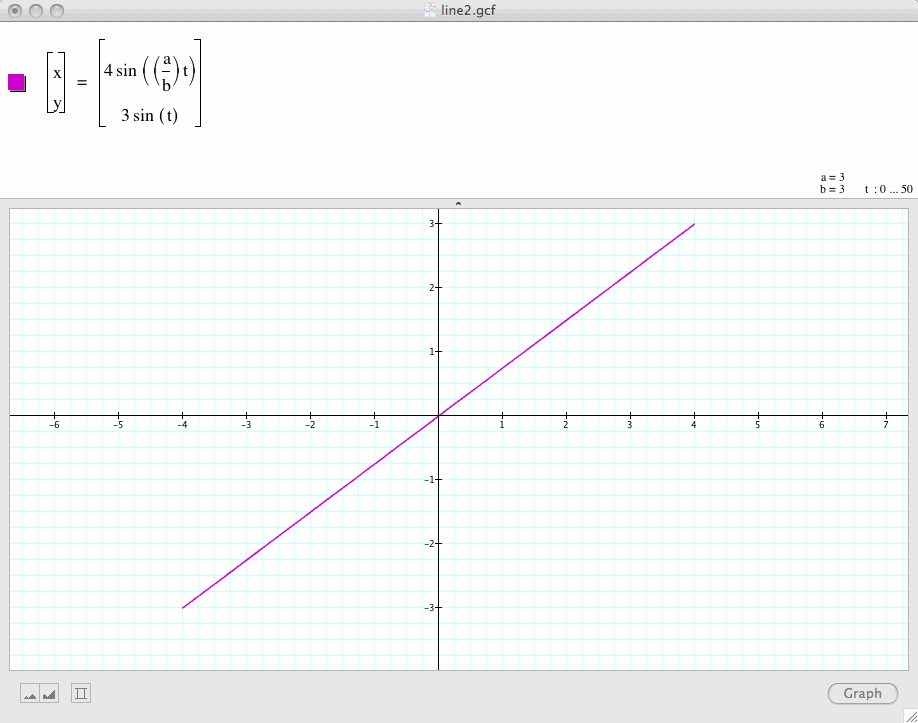
Observe when a=1 and b=1, we get a straight line for this set of parametric curves.
Let's now holding a at 1 and change b and see what happens:
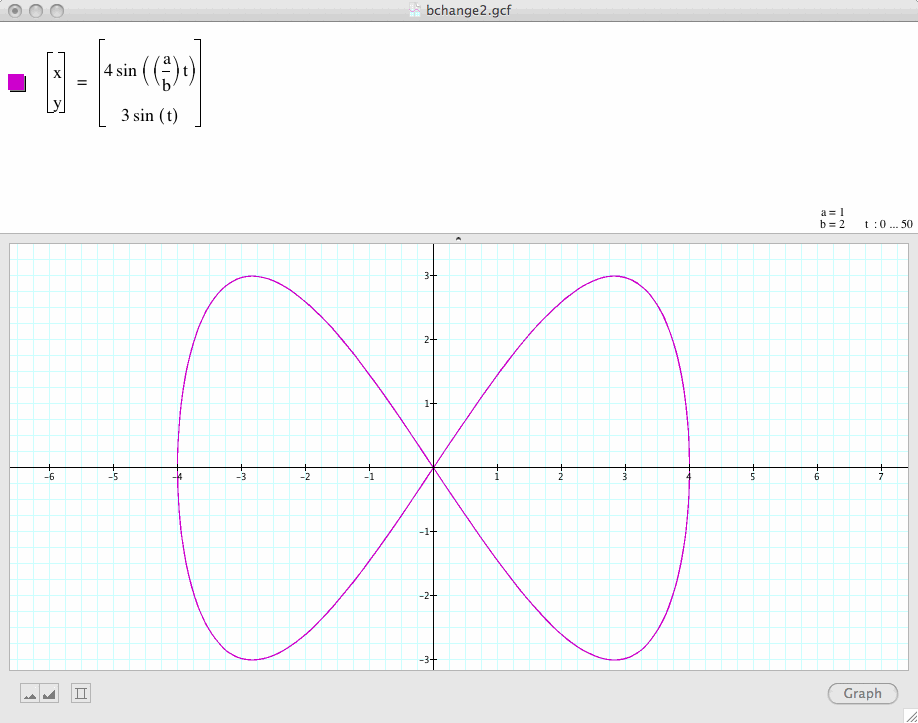
We note that when a=1 and b=2, and their ratio is (1/2), we have a closed graph with two loops and one knot at (0,0);
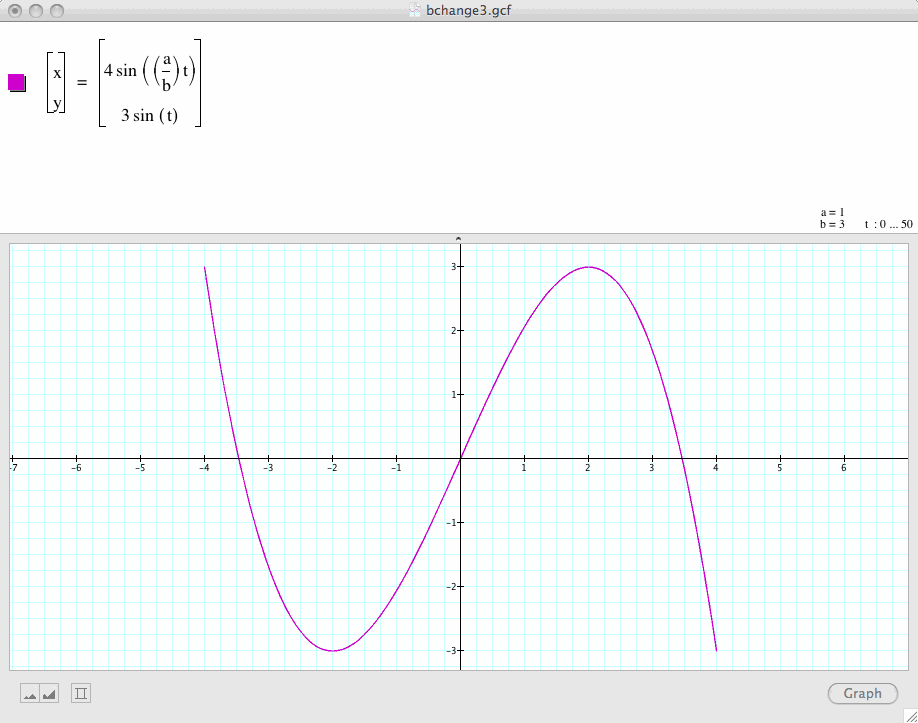
when a=1, b=3, and their ratio is (1/3), we have a open graph with two turns and three parts (decrease-increase-decrease).
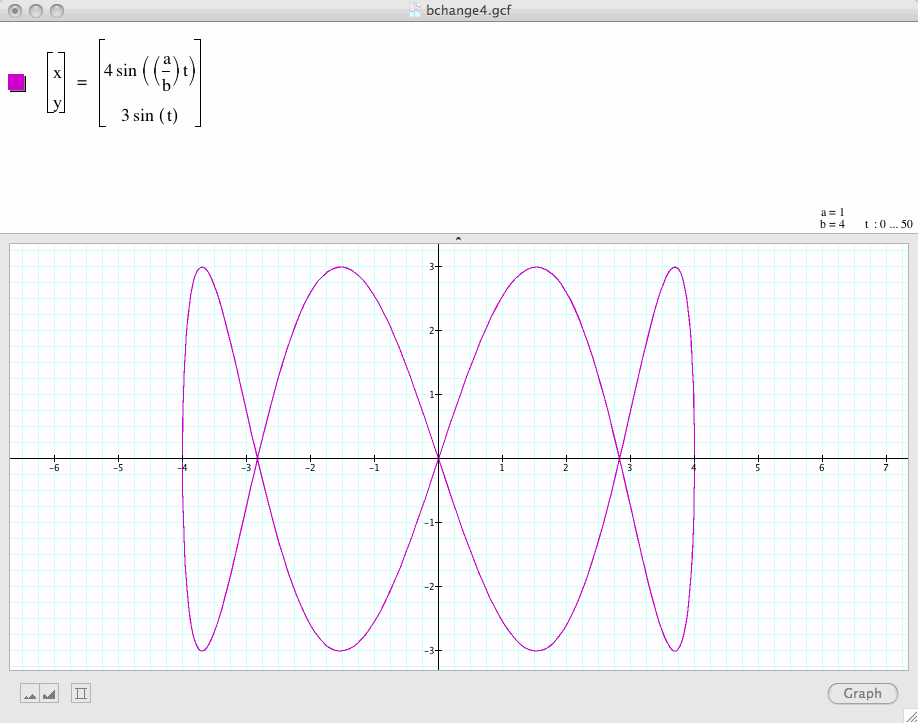
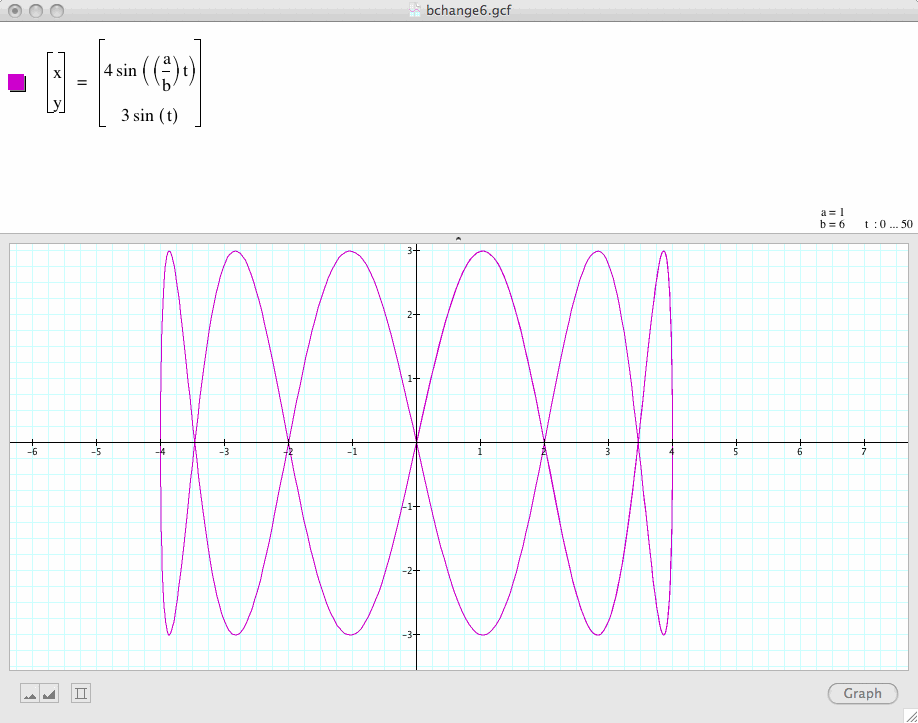
Now we conjecture that whenever b is an even number, we get a closed graph,
and whenever b is an odd number, we get an open graph.
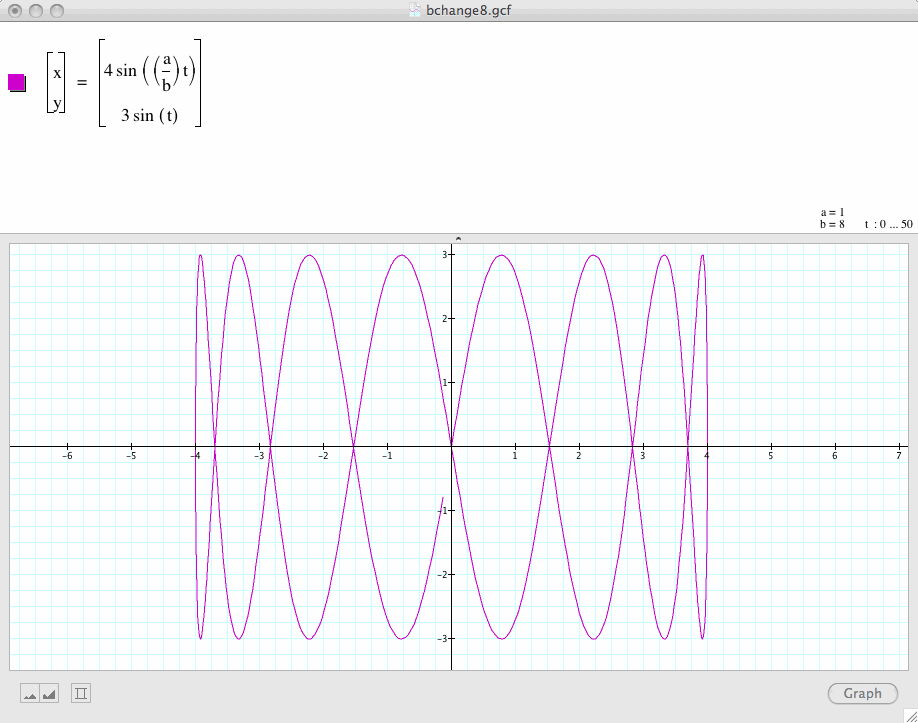
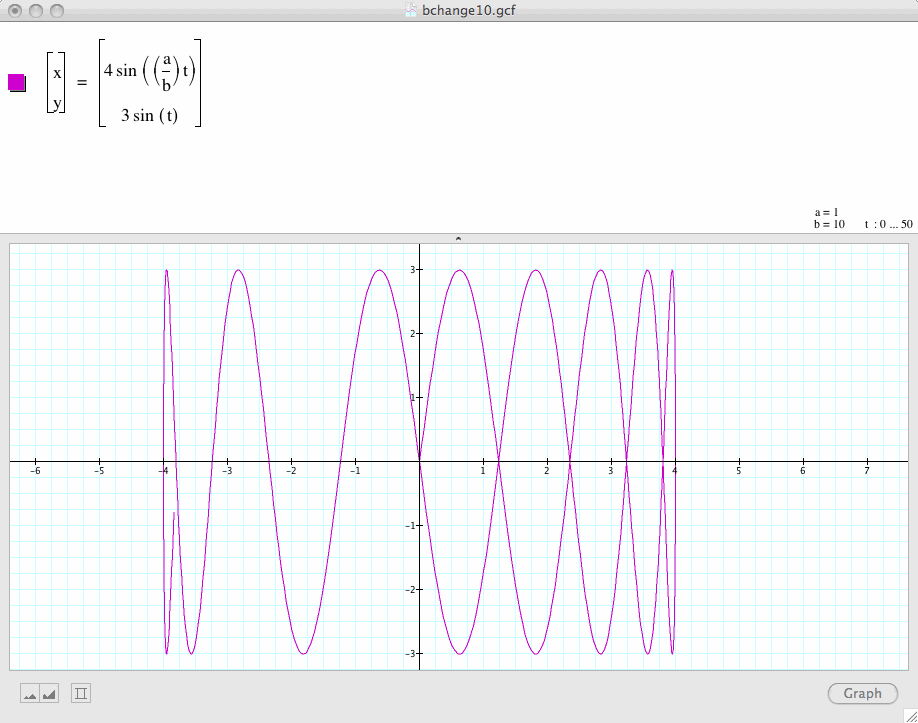
We then tried b=4, b=6, b=8, and b=10 while a remains at 1.
These graphs are all closed up until b=10 in that case,
we observe that the graph becomes more clustered on the right, and on the left, it becomes open.
For b=2, 4, 6, and 8, we get b loops and b-1 knots.
Next, let's see what happens, if we hold b constant at 1 and change the value of a:
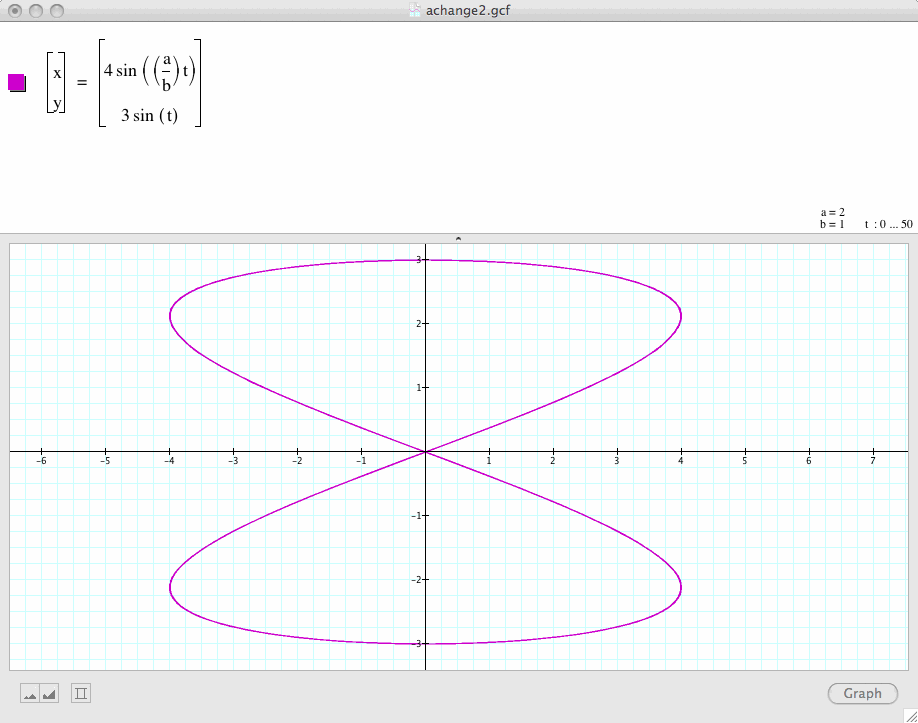
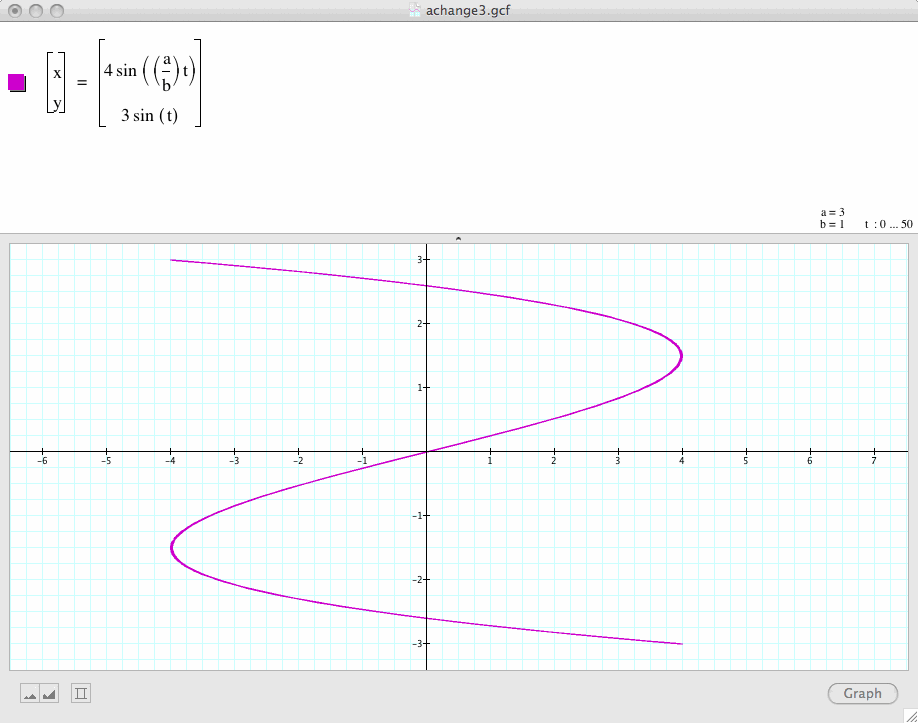
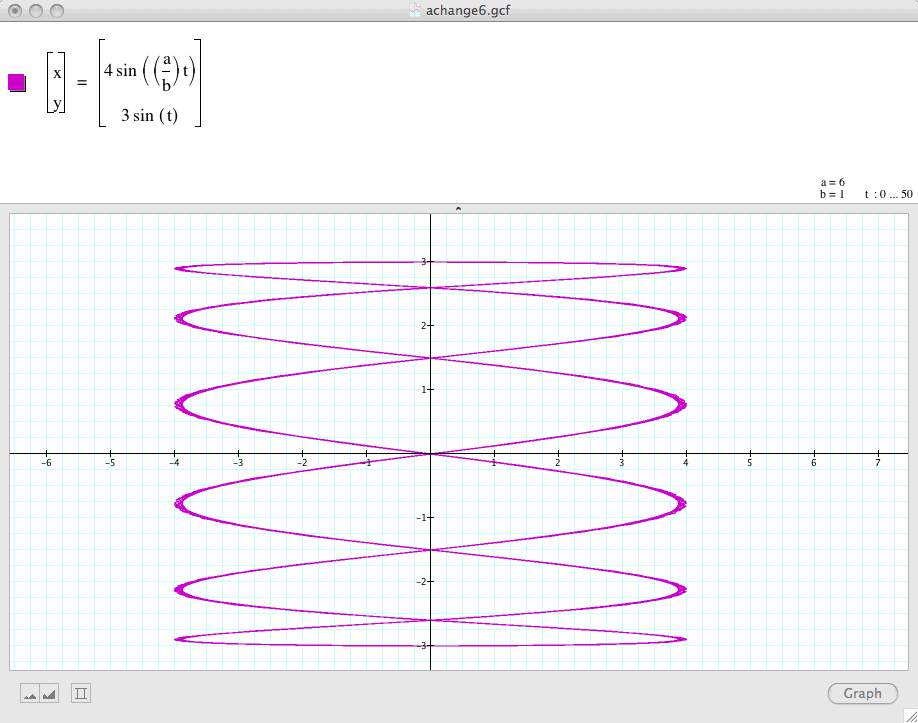
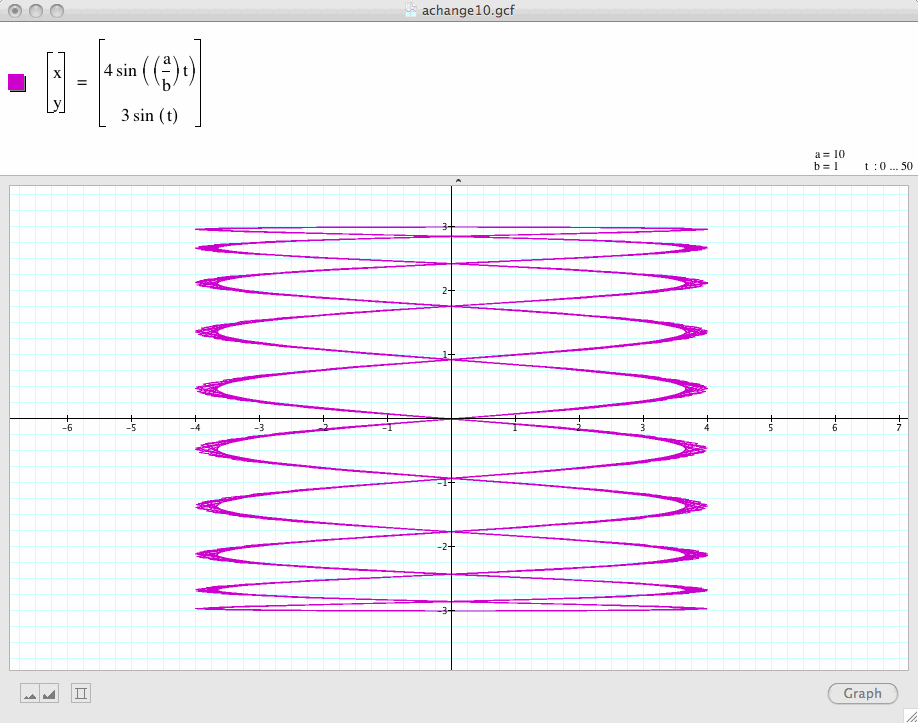
We notice that pretty much the same happens when we try to change b except for two things:
first the direction of the loops changes; second, when a=10, the graph is still closed.
Another interesting observation is that all graphs we have observed so far are somewhat bounded by a rectangle with dimensions of 2*4 and 2*3.
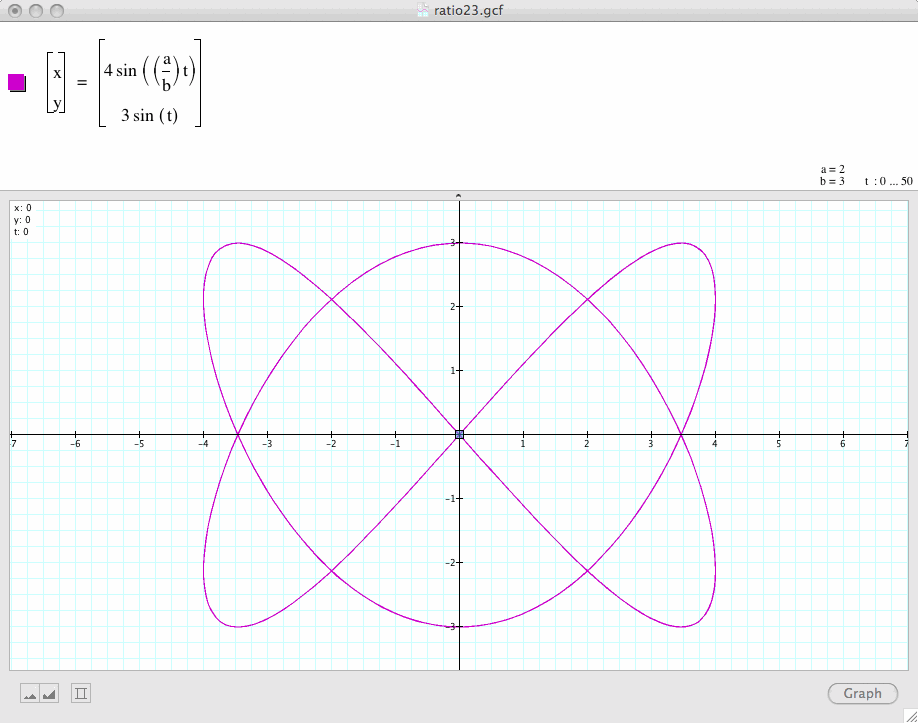
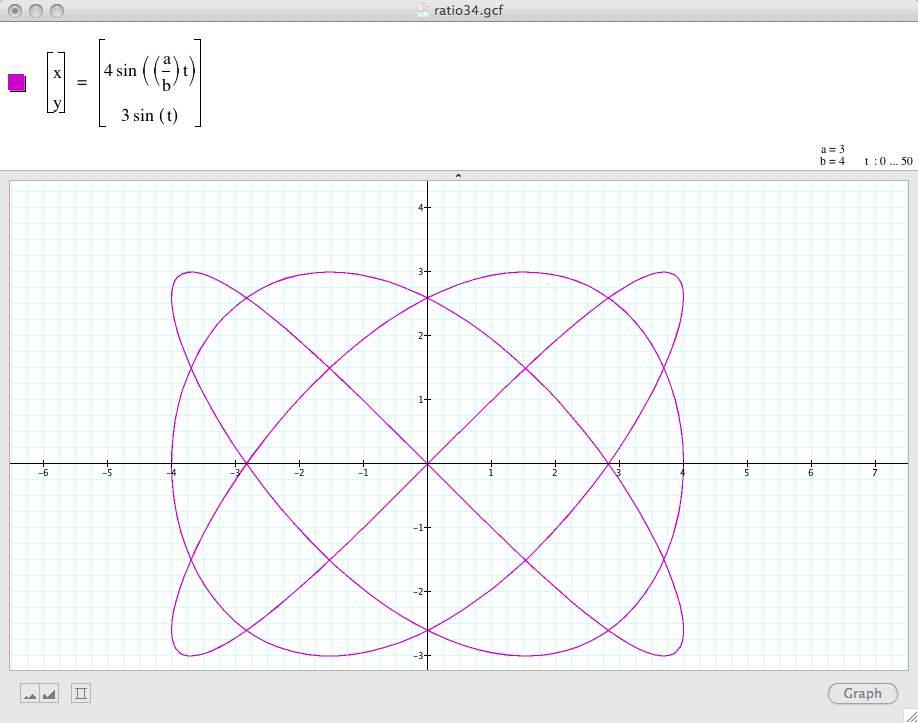
Next, let's try some different ratios of a and b such as (2/3), (3/4), (6/5), (12/13) and see what happens:
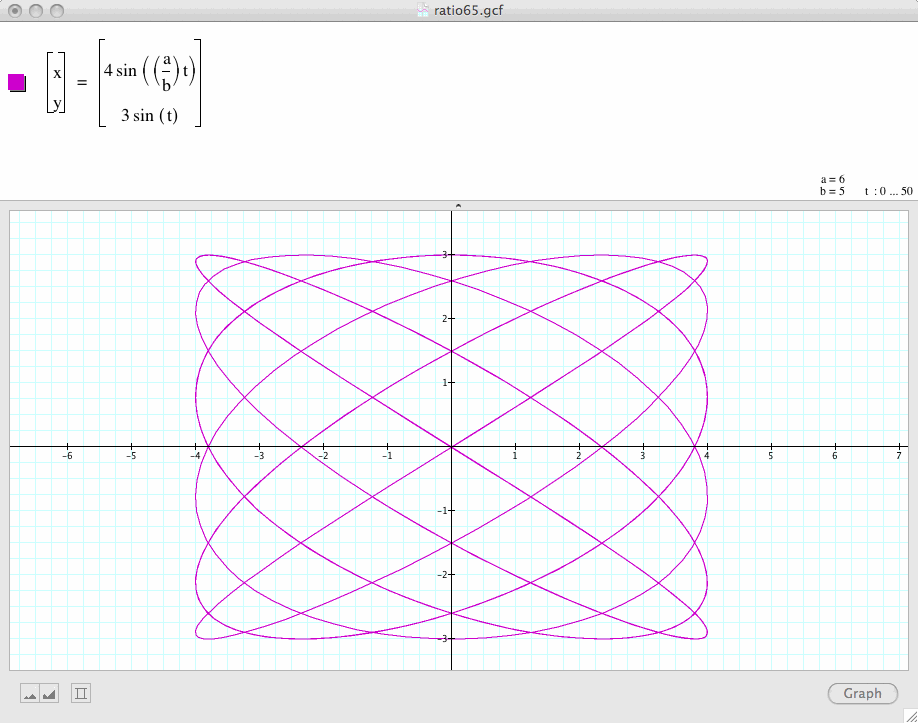
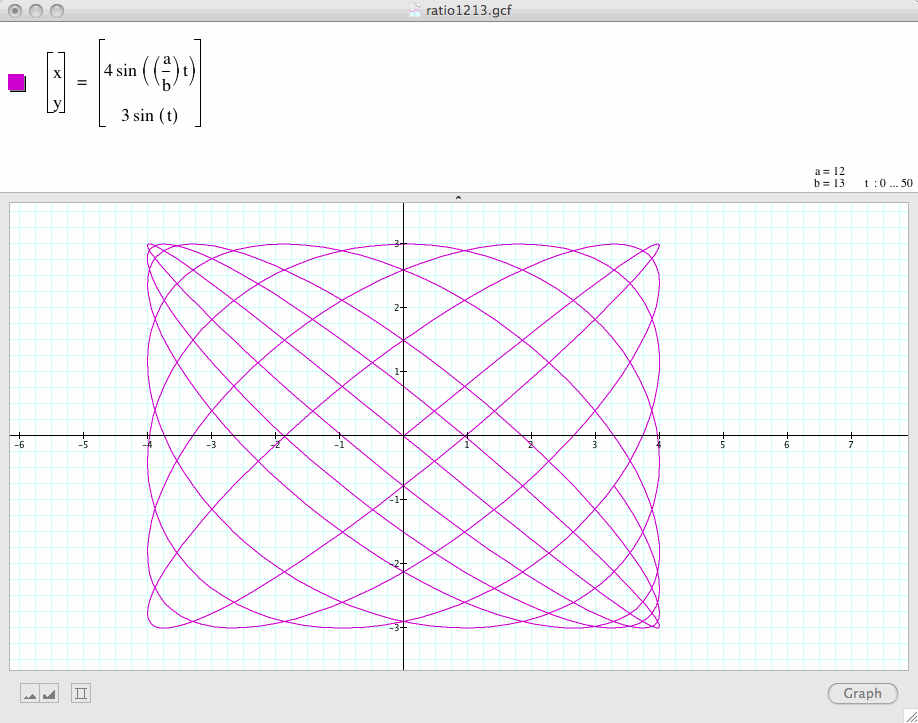
Now we are ready to introduce a Lissajous curve: the graph of the system of parametric equations

or another way to write it:

The appearance of the figure is highly sensitive to the ratio a/b as shown above,
and the graphs are always bounded by a rectangle with length and width dimensions of 2A and 2B.
In the above examples, we ignored ![]() , now let's consider some of the special cases that we have not covered above:
, now let's consider some of the special cases that we have not covered above:
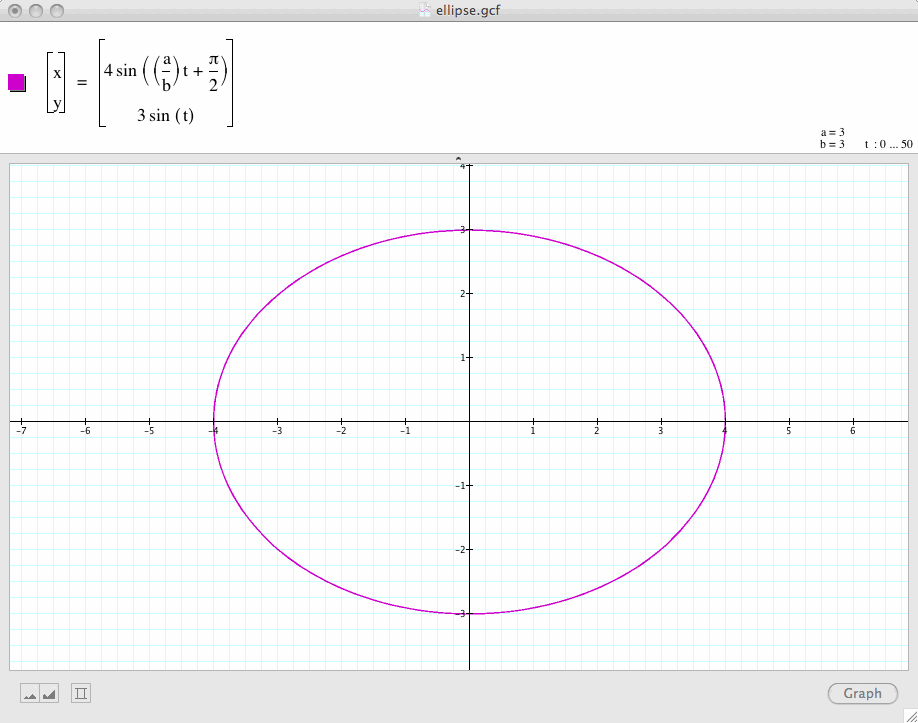
When a/b=1 and ![]() the graph is an ellipse:
the graph is an ellipse:
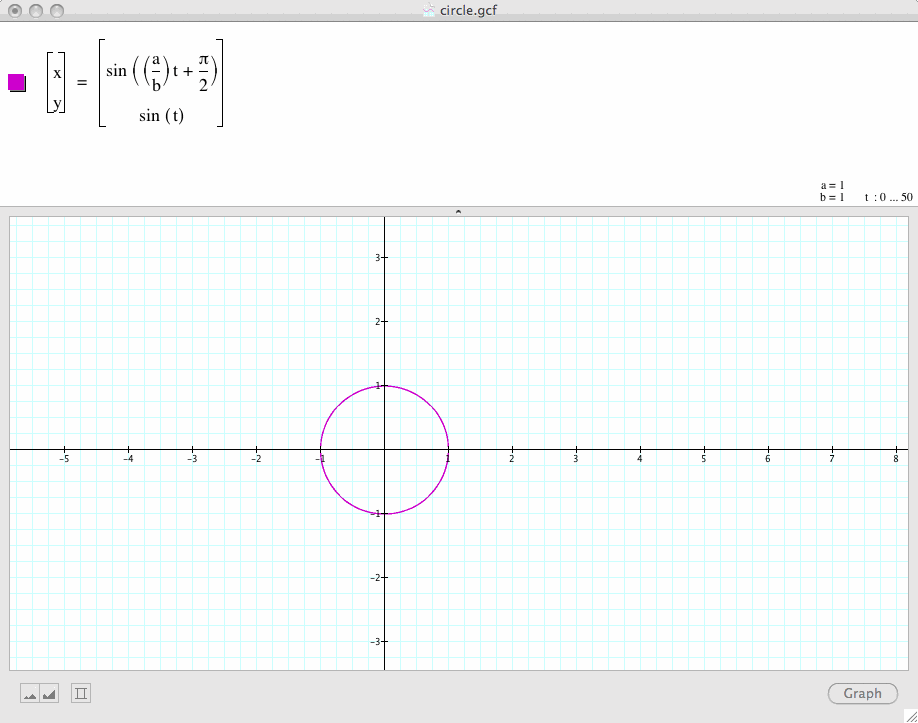
When A=B, and a/b=1, and ![]() , the graph is a circle:
, the graph is a circle:
When A=B, and a/b=1, and ![]() , the graph is a line:
, the graph is a line:
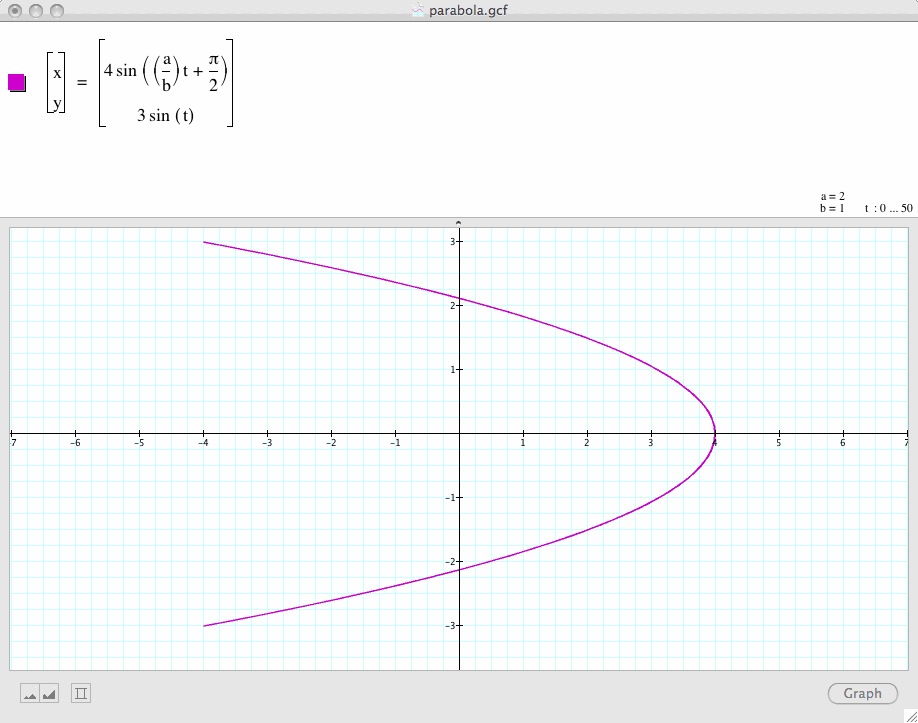
When a/b=2 and ![]() , the graph is a parabola:
, the graph is a parabola:
If you are interested in seeing how change of ![]() affects the graphs, let's use one of the earlier examples to illustrate:
affects the graphs, let's use one of the earlier examples to illustrate:
take the ratio of a/b=2/3, and let's graph
![]()
again with a=2, b=3, but meanwhile, let ![]() take on values of
take on values of
 :
:
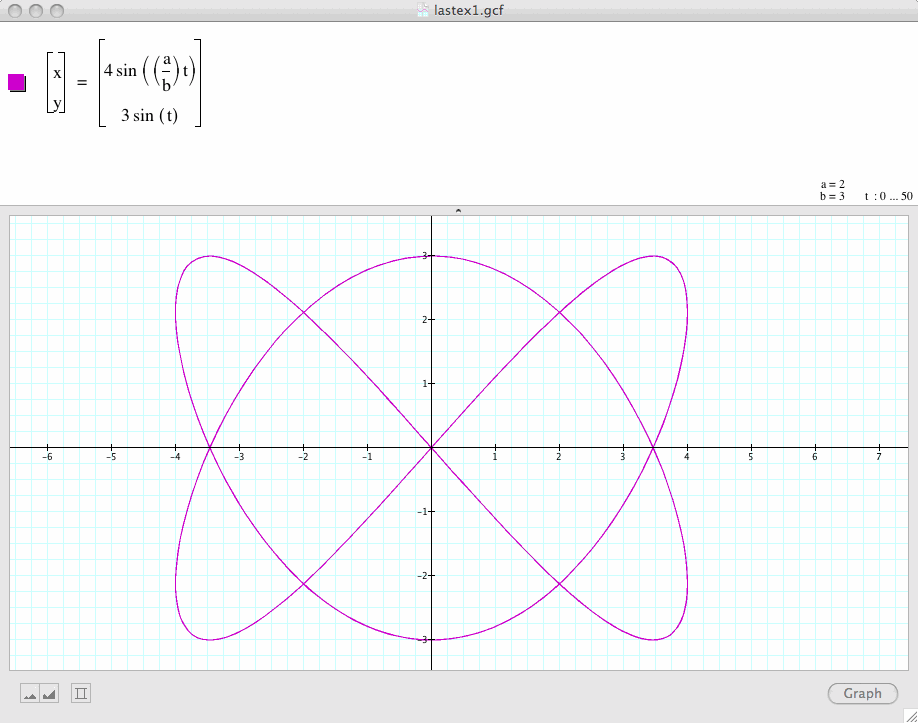
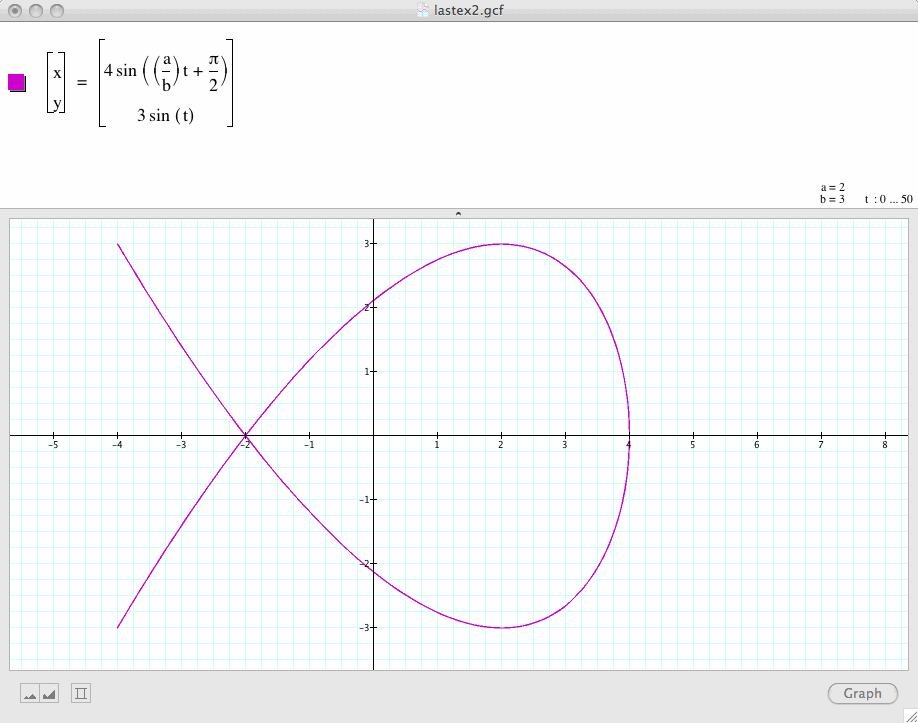
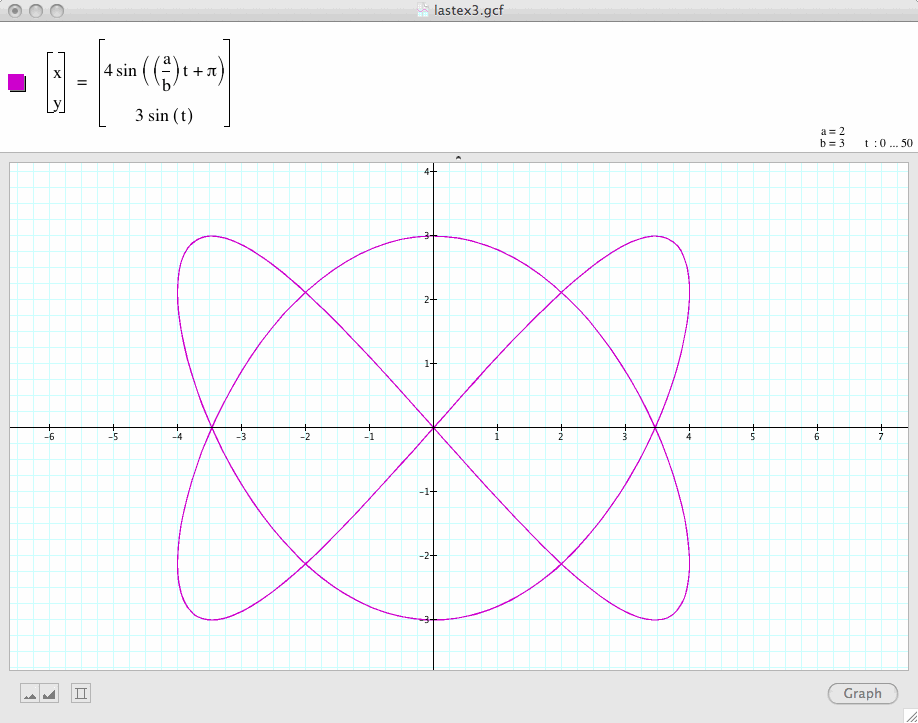
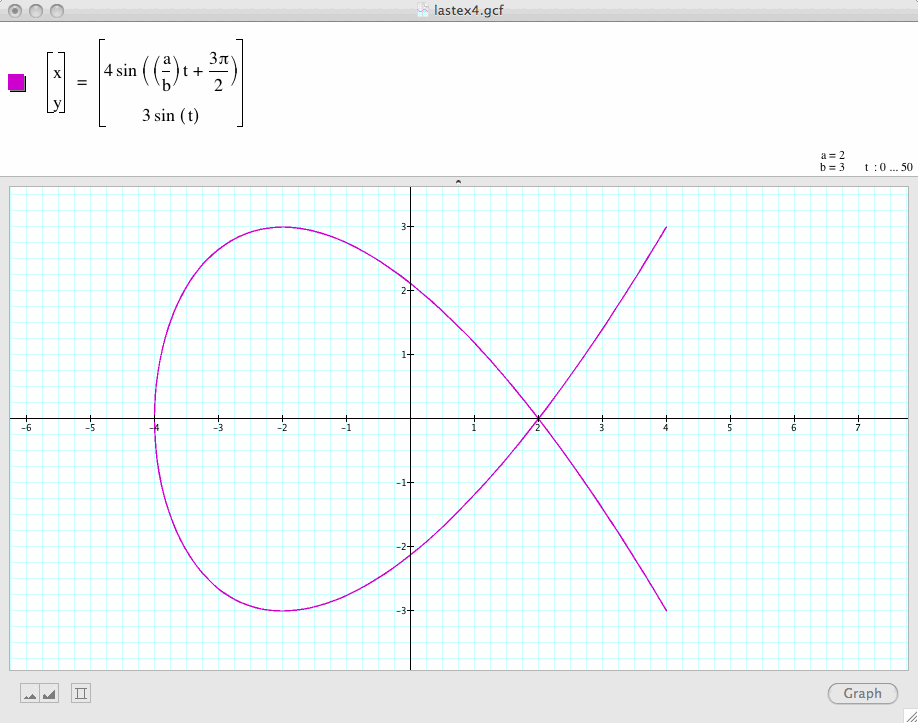
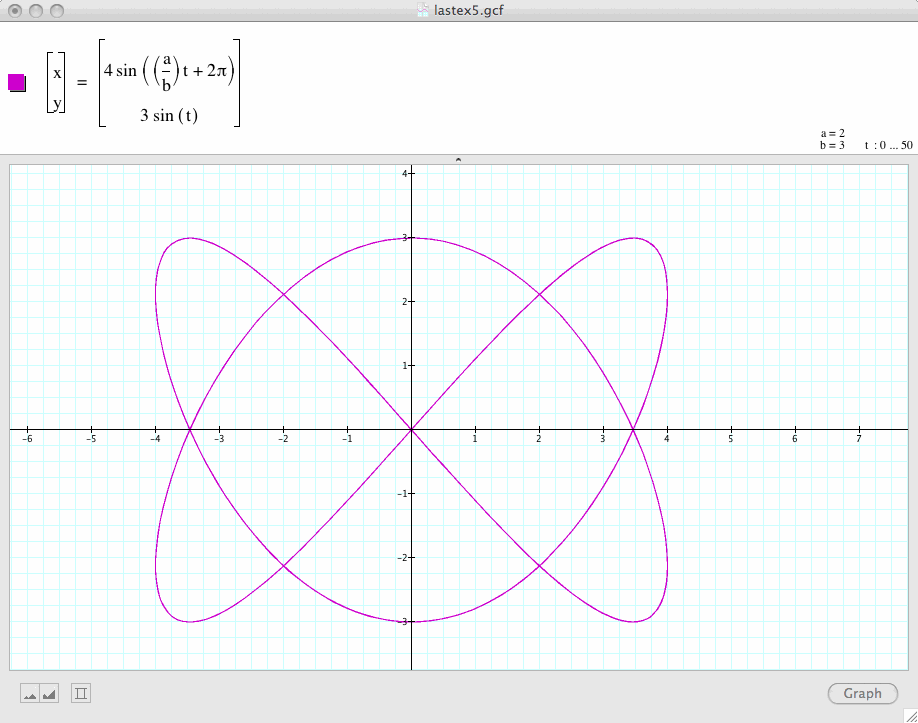
We have noticed that the graphs for the ratio a/b=2/3 are identical when
![]() ,
,
The graphs for ![]() and
and are reflections of each other with respect to the y-axis.
Now it is our turn to try other values of ![]() . Any conjectures? Any conclusions?
. Any conjectures? Any conclusions?
Finally, you should try other combinations of ![]() and a/b ratio and observe the impact of
and a/b ratio and observe the impact of ![]() . Any generalizations possible?
. Any generalizations possible?