Final Assignment: Problem 3
Presented by: Amanda Oudi
Problem 3: An additional Write-Up
This is a Write-Up for Assignment 12, problem 11. I decided to
investigate another problem using EXCEL because I often have negative
experiences using the program. Maybe the more I use the program, the more
positive I will feel about its uses.
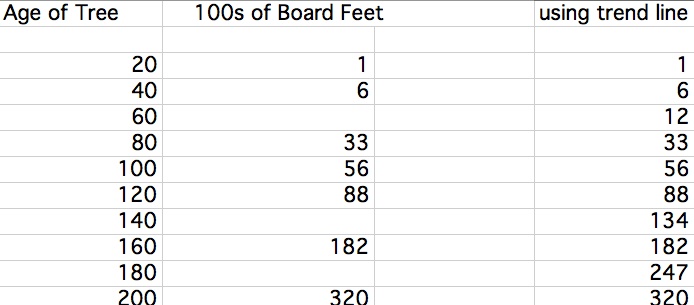
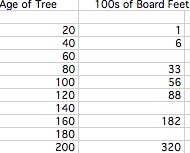
The task is to determine what function will fit the tree data, as well
as predict the harvest for ages other than those given. Here is the EXCEL file.
I began the problem by creating a scatter plot of the data.
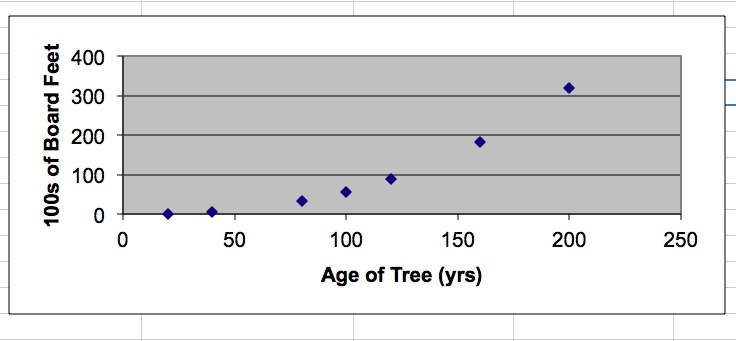
By examining
the scatter plot, it is clear the points do not follow a linear pattern; hence,
a linear function will not satisfy the data. However, a quadratic function
might fit. I tried different equations, such as x^2, .75x^2, .75x^2 + 1 to try
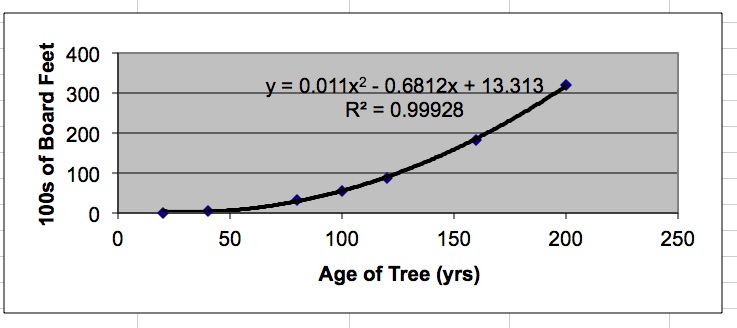
to determine the equation. Finally, I used the EXCEL "add trend line" function to
display the appropriate trend line. The one produced seems to fit the data best
since the line goes through each data point. Also, the R-squared value is .99.
The R-squared value indicates how well the regression line fits data points; a
value of 1.0 indicates the regression line fits the data perfectly. Based off
this, the function produced is a good fit for the data.
Now that we have an equation, we can predict the harvest for ages other
than the ones given. We can substitute the x value (age of tree) into the
equation we found to obtain the missing value!
For instance:
Predict the 100s of board feet for 60 year old tree
Y = 0.011x^2 - .6812x + 13.313
Y = 0.011(60^2) - .6812(60) + 13.313
Y = 12.04
So a 60 year old tree will result in approximately 12,000 board feet.
It is important to note that these values are merely approximations. EXCEL has rounded off the values to 2 - 3 decimal places in the calculation, so we should take round off error into account. Below shows the completed table.