

Assignment 11: Polar Graphs
By: Mary Wisniewsky
Exercise: Investigate
![]()
-Explore when a and b are equal such that k is an integer.
-Compare and contrast:
![]()
-What happens when cosine is replaced with sine?
The Standard graph for
![]()
when a,b,k=1:

Since our variables all equal one, the standard cosine equation would result.
Now let's investigate when a=b=2 with various k values such that k is an integer.
When k=2, what should we expect to see? When k=1, the graph showed one "loop".

Here we have two loops when k =2 where the shape of the graph resembles "a figure 8". What happens when k=3? Should we expect to see 3 loops?
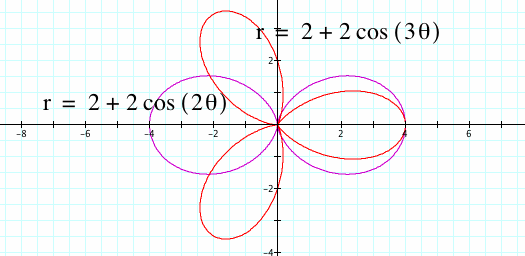
The pattern is simple. Whatever k is equal to (as an integer), this number will correlate to how many loops are present.
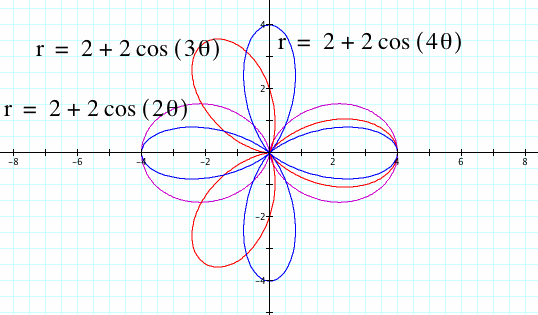
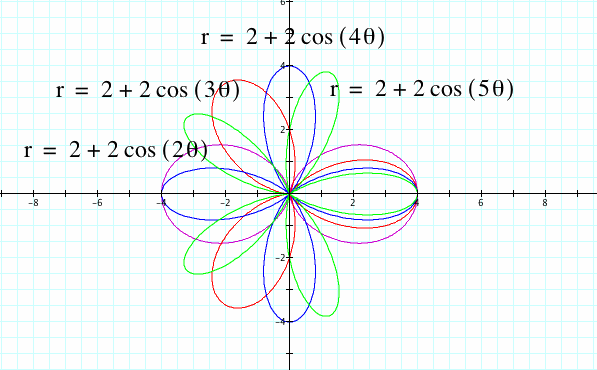
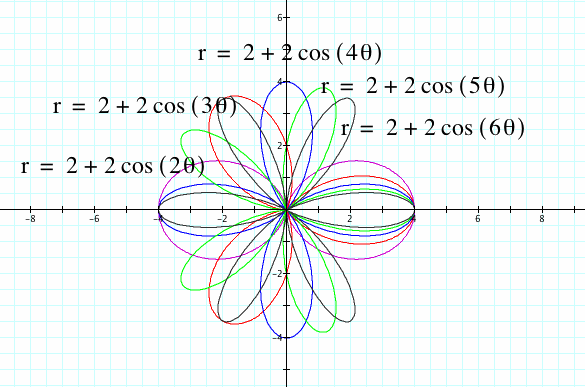
Click the link to see the video of various values of k as an animation.
How do a and b affect the graph? If we set a parameter on a for one equation and a parameter on b for another, what should we expect the graph to look like?
The pink graph shows when the parameter n is set on b when a=2, k=3 and the blue graph shows when the parameter n is set on a when k=3 and b=2.
We notice from these two graphs that as b increases for the pink equation, the shape of the k looped graph expands, but keeps in tact the loops. However when a increases, the shape of the graphs acts as a "barrier" to the pink graph and looses the loops. The blue graph helps compare equation
![]()
to
![]()
When n=0 for the blue equation, then we have this new polar equation. In this equation, we can greatly see how b and k affects the shape of the polar graph. From this animation of these equations, we can see how negative and positive integers affect the direction and transformation of the original parent equation's graph.
In contrast to the original equation, this polar equation keeps k loops as b increases where as a varied a can change the shape entirely.
So, what happens when we replace cosine to get sine and how will this affect the graph?

The difference between the sine and cosine graphs in this polar equation is the direction of shape of the graph varies. For example, with the red and blue graph when k=2, there are still two loops, but the direction of the sine graph was rotated. If we add a translation to our first polar equation in which half of π is added inside the parenthesis then our original graph with cosine appears.
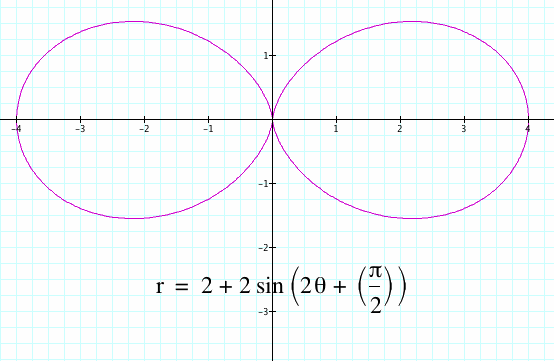
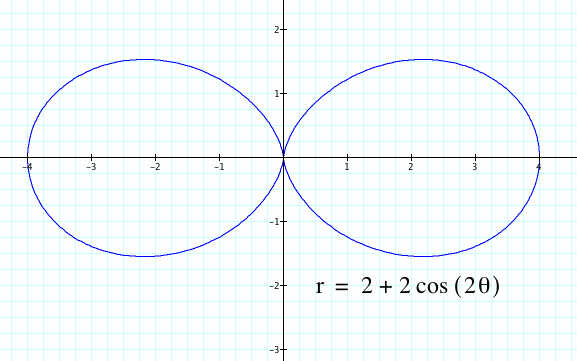
Therefore, the difference between the cosine and sine graphs is in result of a rotation of half of π.
Return to Mary Wisniewsky's Main Page