

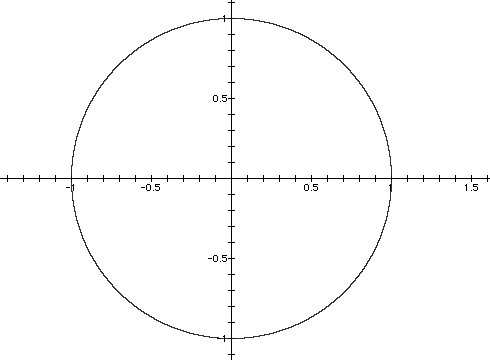
We already know that when n=2, the graph is simply a circle whose center is at (0,0) and radius is 1. Therefore, the circle passes through (0,1) and (0,-1) on the x-axis and (-1,0) and (1,0) on the y-axis.
Notice the graphs compared to the graph of the circle when
n=3 n=4

.
As we look at higher values of n, we begin to notice that there are two families of graphs. The types of graphs are determined by whether n is an even or odd integer.
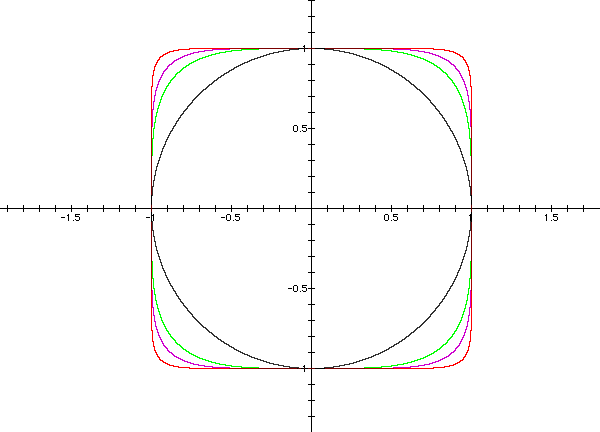
Notice that the graphs are all enclosed areas which, like the circle, pass through (1,0) and (-1,0) on the x-axis; (0,1) and (0,-1) on the y-axis. As the even values of n increases, the graph gradually loses its "curve" and approaches the shape of a square. The "corners" of the graphs become less and less smooth as the integers increase.
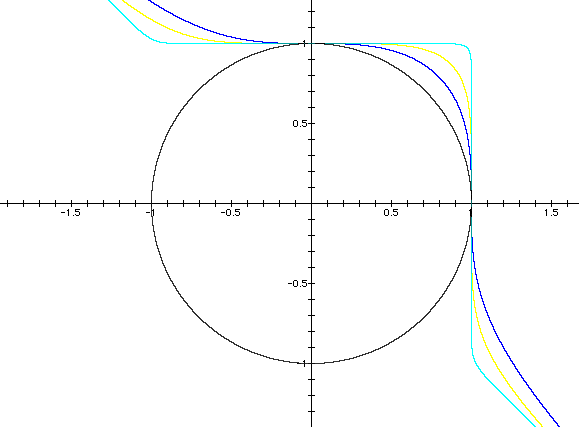
Notice that the graphs are not enclosed areas. Instead, they are curves that pass through (0,1) and (1,0). As the odd values of n increase, the portion of the curve where 0<x<1 become less smooth. That is, the graph progressively changes from a smooth curve to a "corner." In fact, these portions of the graphs are similar to the "corners of the graphs of the equations containing even integer values of n.
One might be curious about the "tail ends" of the graphs. If we look at the graphs farther out, we notice that the "tail ends" of the graphs appear to eventually coincide.
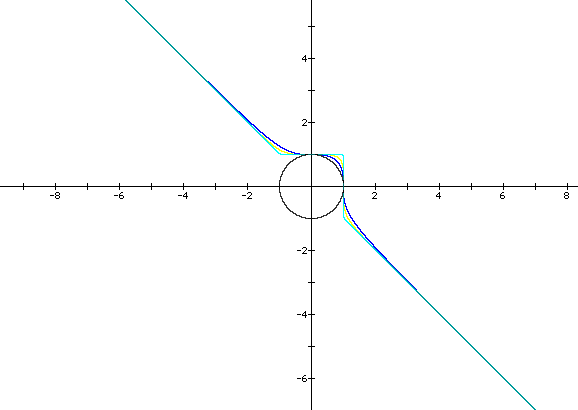
We might be tempted to declare that the lines appear to coincide along a portion of the line y=-x. However, we should investigate to see if this in fact happens.
We begin by looking at the above graphs as they compare to the graph of the line y=-x as opposed to the graph of the circle.
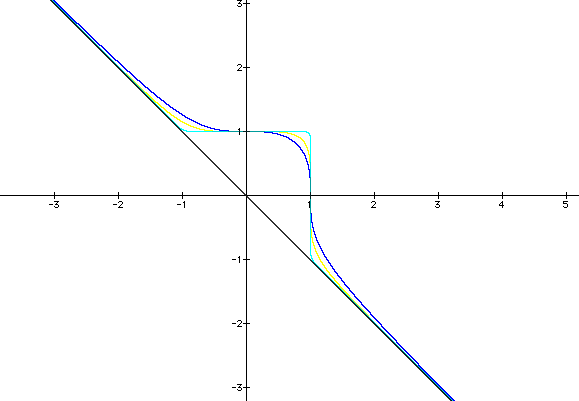
The "tail ends" of the graphs are in fact asymptotic to the line y=-x.