In one of the high schools where the second author used to teach, if you asked students to solve a quadratic equation,
the FIRST thing many would do is unsheath their graphing calculators and tell you that they were going to "graph it" and find the x-intercepts. (Some would tell you they were going to "graph the parabola" and graph the x-axis and then find the intersection points.) This now rather standard technique was certainly not prominent when either author was in high school! And of course, it has some limitations, since complex solutions are not readily obtainable. It also can obscure the difference between an equation and a function.
Therefore, the aim of this paper is to go beyond the "graph and find zeros" or "graph and intersect" techniques and look at ways to characterize the roots of a quadratic equation by examining its related quadratic function and other relations. That is, we will graph the quadratic function
for different values of a, b, or c as the other two values are held constant. From these graphs, we can discuss patterns of roots for the corresponding quadratic equation, ax^2 + bx + c = 0 by examining the locus of vertices as a, b, or c varies. However, we can actually go a step farther and consider the xa, xb, and xc planes, and how relations graphed there can give us further insight into the nature of the roots of the quadratic equation.
To navigate through the paper, you can choose to jump to discussions of
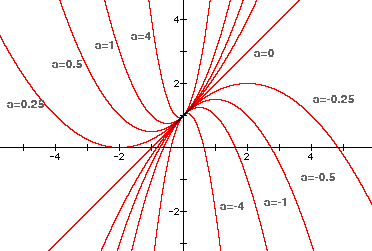
Consider the graphs below of y = ax^2 + x + 1 with the values of a varying as indicated. Obviously, for some values of a, there will be no real solutions for the corresponding quadratic equation, ax^2 + x + 1 = 0. In particular, for a greater than about 0.25, the quadratic function appears to have no real x-intercepts or zeros, and so the corresponding quadratic equation would have no real roots.

To determine the exact value of a for which the quadratic equation will have exactly one real root, we have to try to find the value of a that "gets the parabola tangent" to the x-axis. Note that though it is common to call that one real root a double root, for sake of clarity throughout this paper, we will refer to a double root as "one real root."
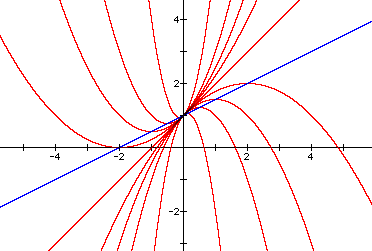
Examining the locus of vertices is both interesting and helpful in our quest to find this key value of a. As you can see below, the locus of vertices forms a line with equation y = 0.5x + 1.
 |
For more information about the locus of vertices as a varies, see this proof and dicussion of the significance of the function that describes the locus. |
Notice that to find the value of x for which ax^2 + x + 1 = 0 has one real root, we simply want to find the zero of the "blue graph," y = 0.5x + 1. Algebra tells us the zero is x = -2, which we can confirm visually with the graph. Therefore, when x = -2, the quadratic equation ax^2 + x + 1 = 0 will have one real root. To find the key value of a for which the equation has one real root, we can substitute x = -2 into the equation and solve for a. We get a = 0.25, as we suspected.
Note also that at a = 0, the "quadratic" becomes a line with equation y = x + 1 (with a single zero at x = -1.) This observation is consistent with the conjecture that for values of a below 0.25 the corresponding quadratic equation will have at least one real root; however, presumably for values of a between 0 and 0.25, there will be two roots, as there certainly are two real roots for values of a less than 0.
Here's one way to visualize how the value of a affects the zeros of the quadratic function and therefore the types of roots of the corresponding quadratic equation. Consider the graph of yx^2 + x + 1 = 0, where we think of the y-axis as the a-axis.
| The red graph is yx^2 + x + 1 = 0 (or
ax^2 + x + 1 = 0), and the blue line is y = -1, or a = -1. 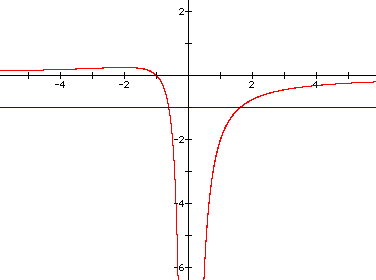 |
The intersections of the relation and line occur at x = 1.62 and x = -.62. Notice that the roots of -1x^2 + x + 1 = 0 are also x = 1.62 and x = -.62. So, for specific values of a on the a-axis, we can find the zeros of the quadratic function y = ax^2 + x + 1, and the roots of ax^2 + x + 1 = 0. |
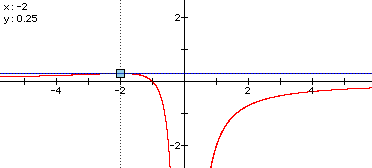
As you can see, the maximum value occurs when the value of a is 0.25. For this value of a, the one real root (or double root) of 0.25x^2 + x + 1 = 0 will be x = -2.
To summarize, for all values of a > 0.25, the quadratic equation ax^2 + x + 1 = 0 has no real solutions; for a = 0.25, there is one real root; and for a < 0.25, there are two real solutions except at a = 0, in which case the quadratic equation "degenerates" into a linear equation with one root at x = -1.
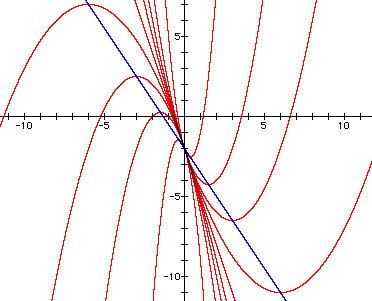
Of course, other values of b and c will affect the graphs for varying values of a, both in the xy and xa planes. Below are two related graphs when b = -3 and c = -2. The first graph shows y = ax^2 - 3x - 2 for varying values of a. The locus of vertices, y = -1.5x - 2, is also graphed in blue. You can see that this time for values of a lower than a little less than -1, the graph ceases to have real roots.
In fact, at x = -4/3, (the zero of y = -1.5x - 2), the quadratic ax^2 - 3x - 2 = 0 should have exactly one real root. Therefore, (subsituting x = -4/3 and solving for a), we find that at a = -1.125, the quadratic will have exactly one real root.
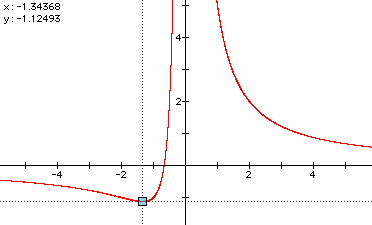
And in fact, as shown by the graph of the xa plane (i.e. the graph of yx^2 - 3x -2 = 0 or ax^2 -3x - 2 = 0), the minimum value occurs at about a = -1.12. For that value of a, the quadratic equation will have one real (or double) root of about -1.3. For a greater than approximately -1.12, the equation will have two real roots, and for a less than approximately -1.12, the equation will have no real roots.
Return to the Write-Ups on Amy's Class Page
Now consider the graphs below of y = x^2 + bx + 1 with the values of b varying as indicated. Obviously, for some values of b, there will be no real roots for the corresponding quadratic equation, x^2 + bx + 1 = 0. In particular, for -2 < b < 2, or |b| < 2, the quadratic function appears to have no real x-intercepts or zeros, and so the corresponding quadratic equation has no real roots.
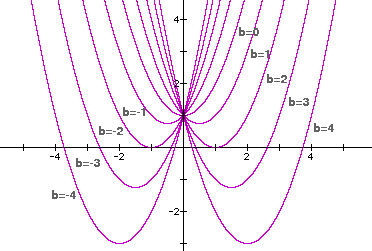
Unlike our investigation with a, there appear to be two values of b for which the quadratic equation will have exactly one real root. Also notice that when b = 0, the resulting function and corresponding equation are still quadratic, i.e., y = x^2 + 1, unlike when a = 0. Similar to our investigation of a, however, we are still interested in the values of b that "get the parabola tangent" to the x-axis.
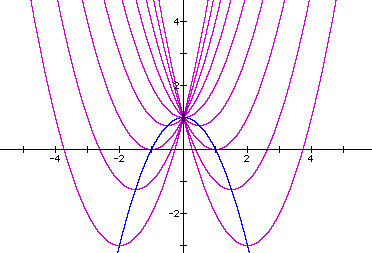
Examining the locus of vertices of the parabolas as b varies is also instructive in this situation. This time the locus of vertices forms a parabola, whose equation is y = -x^2 + 1, as you can see by viewing the blue graph below.
 |
For more information about the locus of vertices as b varies, see this proof and discussion of the significance of the function that describes the locus. |
Since y = -x^2 + 1 has positive y-values for |x| < 1, the vertices for the purple parabolas will lie above the x-axis for |x| < 1. Since a is greater than 0 in the function y = x^2 + bx + 1, all parabolas "open up," and so we can deduce that for |x| < 1, the quadratic equation x^2 + bx + 1 = 0 has no real roots. That is, for |x| < 1, which means for |b| < 2, these quadratic functions cannot intersect the x-axis. Similarly, since the y = -x^2 + 1 has negative y-values for |x| > 1, the quadratic equation x^2 + bx + 1 = 0 will have two real roots for |x| > 1, i.e., for |b| > 2.
Examining the xb plane can provide further some further insight and confirmation. Consider the graph of x^2 + yx + 1 = 0, where we think of the y-axis as the b-axis.
| The purple graph is x^2 + yx + 1 = 0 (or
x^2 + bx + 1 = 0), the black line is y = - 4 or b = - 4; and the blue lines are y = - 2 and y = 2, or b = - 2 and b = 2. 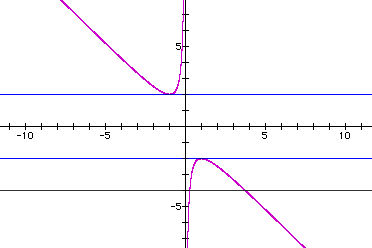 |
As with the xa plane, the intersections between the hyperbola and the horizontal lines indicate the values of real roots of x^2 + bx + 1 = 0 for specific values of b. For b = - 4, the intersections are x = 0.27 and x = 3.73. And indeed, the solutions for x^2 + - 4x + 1 = 0 are x = 0.27 and x = 3.73. Similarly, for b = - 2 and b = 2, the single real roots are 1 and -1, respectively. Finally, it is easy to see that for b-values between -2 and 2, there will be no real roots. |
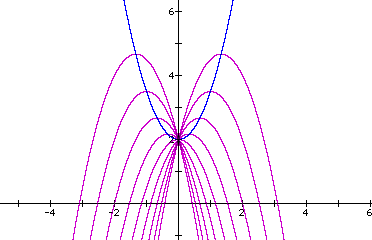
Here's another example, with both the xy plane and xb plane shown for a = -1.5 and c = 2. That is, the first graph shows y = -1.5x^2 + bx + 2 for varying values of b (integers from -4 to 4). Notice that the locus of vertices, y = 1.5x^2 + 2 (shown in blue), does not intersect the x-axis. Therefore, the purple graphs will never become tangent to the x-axis! So there will never be only a single real root for the corresponding quadratic equation. And in fact, since the value of a < 0, the purple parabolas will always "open down" and intersect the x-axis in 2 places. So we claim that the corresponding quadratic equation will always have two real roots.
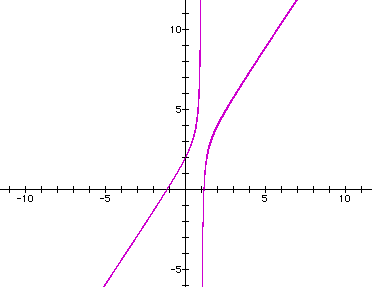
And in fact, as shown by the graph of of the xb plane (i.e. the graph of -1.5x^2 + yx + 2 = 0 or -1.5x^2 + bx + 2 = 0), it is clear that every horizontal line will intersect the hyperbola in two places. So our claim is justified!
Return to the Write-Ups on Amy's Class Page
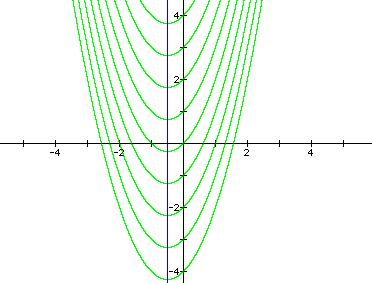
Fortunately, analyzing the nature of the roots of the quadratic equation x^2 + x + c = 0 as c varies is relatively simpler than the analysis for a and b! Many people know even without graphing that changing c merely translates the graph vertically, as shown below. Thus, the locus of vertices is a vertical line (shown in blue), x = -0.5.
 |
For more information about the locus of vertices as c varies, see this proof and discussion of the significance of the function that describes the locus. |
In these graphs of y = x^2 + x + c, c varies through the integers from -4 to 4, and we can clearly see that the function will have a single real zero for a value of c between 0 and 1. For c-values greater than this key value, there will be no real roots of the corresponding quadratic equation, and for c-values less than this key value, there will be two real roots.
Again, the intersection of the locus and the x-axis tells us the x-coordinate (x = -0.5) for which the parabola y = x^2 + x + c will be tangent to the x-axis. Subsituting this value of x into x^2 + x + c = 0 and solving for c, we find that c = 0.25, the key value that allows us to characterize the roots of the equation.
Again, to confirm our analysis, let's examine the graph of x^2 + x + y = 0, or x^2 + x + c = 0, where we think of the y-axis as the c-axis. It shouldn't be too much of a surprise that we produce a parabola, y = -x^2 - x, or c = -x^2 - x. The vertex of this parabola give us the c-value for which there is one real root to the quadratic equation; namely, at c = 0.25, the single real root to x^2 + x + 0.25 = 0 is x = -0.5.
Furthermore, the blue line, which represents y = -2 or c = -2, intersects the graph at x =1 and x = -2, which are indeed the roots of x^2 + x + -2 = 0.
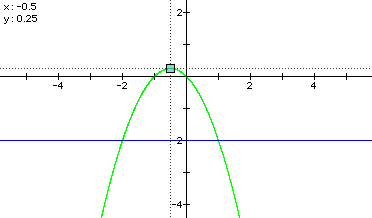
So, in summary, for c > 0.25, there will be no real roots to the quadratic equation x^2 + x + c = 0; for c = 0.25 there will be a single real root; and for c < 0.25 there will be two real roots.
We hope you have found it instructive (if not exhaustive!) to examine the loci of vertices and to view the xy and xa, xb, and xc planes in examining the nature of the roots of standard quadratic equations. Certainly the mulitple views can provide further insight for both teachers and students into the analysis of a standard class of functions and equations in the high school curriculum.
Return to the Write-Ups on Amy's Class Page