
Objective: To find the amplitude, period, phase shift, and vertical shift of sine and cosine functions; to graph sine and cosine functions with various amplitudes, periods, phase shifts, and vertical shifts.
Graphing more than two elements of a sine or cosine function by hand can become very confusing. The easiest way to graph these complicated equations is to work in stages.
The general form of any sine or cosine function looks like this:
where A affects amplitude, B affects period, C affects phase shift, and D affects vertical shift.
When we graph in stages, we start by graphing the basic sine or cosine function. Then, if there is an A in the equation, we change the basic function based on this amplitude (if no A, skip this step). Next, if there is a B in the equation, we change the PREVIOUS graph based on this period (if no B, skip this step). And so on for C and D. The graph created in the last step is the final graph!
Note: We will graph all stages on the same coordinate plane. It is best to graph each step with a different color, so as not to confuse ourselves. Be careful to label or code the stages of your graph!
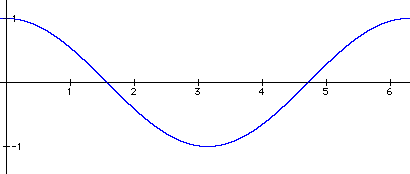
Step 1 - Graph y = cosx (in blue).
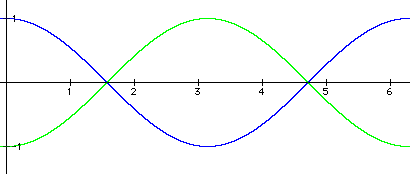
Step 2 - There is no amplitude change, but we know that the negative in front of the cosine means the graph "flips" around the x-axis. So graph y = -cosx (in green).
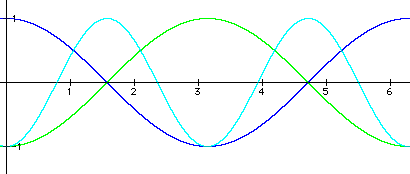
Step 3 - There is a period change, so we'll now graph y = -cos2x (in turquoise). The period is 2p/2 = p. We'll take the graph from step 2 and "squeeze" it so that instead of having one period from 0 to 2p, it will have one period from 0 to p.
Step 4 - There is a phase shift change of p/2 units to the right. So, we'll now graph y = -cos2(x - p/2) (in purple). To do this, we'll simply take the graph from step 3 and move each point to the right p/2 units.
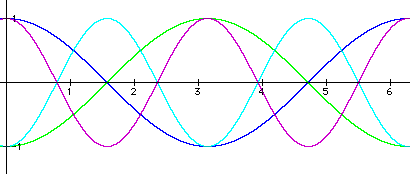
Step 5 - There is no vertical shift, so the graph from step 4 is actually the final graph. We're done!
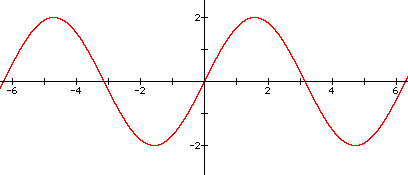
Step 1 - We can always combine steps if we feel comfortable. For example, we all know what the graph of y = sinx looks like, but we also know what the graph of y = 2sinx looks like. Instead of graphing both of these equations as two separate steps, we can combine them and go ahead and graph y = 2sinx (in red).
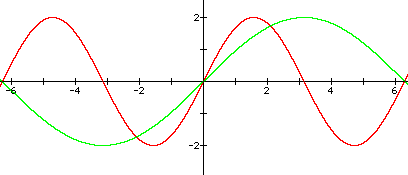
Step 2 - There is a period change, so we'll now graph y = 2sin0.5x (in green). The period is 2p/0.5 = 4p. We'll take the graph from step 1 and "stretch" it so that instead of having one period from 0 to 2p, it will have one period from 0 to 4p.
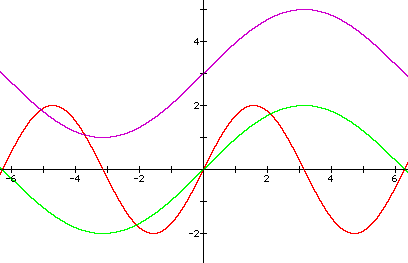
Step 4 - There is NO phase shift change, so we'll move on to the vertical shift. There is a vertical shift of 3 units up. So, we'll next graph y = 2sin0.5x + 3 (in purple). To do this, we'll simply take the graph from step 2 and move each point up 3 units. This is our final graph!
1. Find the amplitude, period, phase shift, and vertical shift of the given functions.
a) y = -2sin(2x + p/2)
b) y = cos(x + p/2) - 3
c) y = 2cos(3x + p/2) + 4
d) y = 3sin(0.5x - p/2)
2. Graph the following functions over the given intervals.
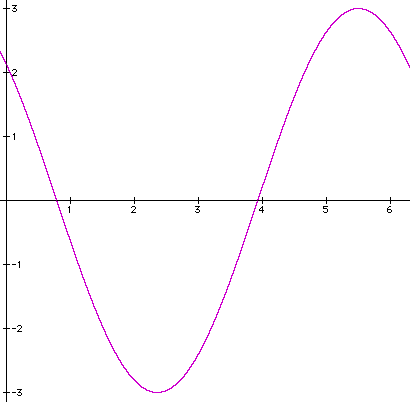
a) y = -3sin(x - p/4), [0, 2p]
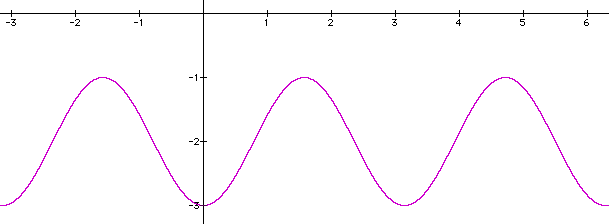
b) y = cos2(x + p/2) - 2, [-p, 2p]
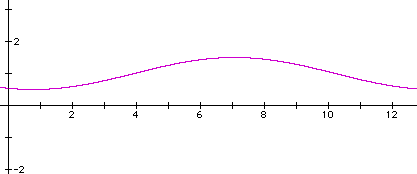
c) y = -0.5cos0.5(x - p/4) + 1 [0, 4p]
d) y = -sin0.5x + 1, [0, 4p]
1.
a) (First, factor out 2: y = -2sin2(x + p/4)) amp = 2, pd = p, ps = p/4 left, vs = 0
b) amp = 1, pd = 2p, ps = p/2 left, vs = 3 down
c) (First, factor out 3: y = 2cos3(x + p/6) + 4) amp = 2, pd = 2p/3, ps = p/6 left, vs = 4 up
d) (First, factor out 0.5: y = 3sin0.5(x - p)) amp = 3, pd = 4p, ps = p right, vs = 0
2.
a)
b)
c)
d)
