Write-up #2
of Parabolas
by
I will begin by graphing ![]() where d = 0. We get a parabola opening up with its vertex at (0, -2).
where d = 0. We get a parabola opening up with its vertex at (0, -2).

Let's examine this equation further to see what happens when the value of d is changed. ( In all explorations our original equation will be graphed in blue.)
Let's start with the integers.
When d > 0 or when d is positive
|
|
|
|
|
|
|
|
|
|
|
|

We can see in these graphs that the shape of the parabola
does not change, however, it is being translated or shifted horizontally
to the right as d increases. In general, the vertex is located at ( d,
-2 ).
When d < 0 or when d is negative
|
|
|
|
|
|
|
|
|
|
|
|

Again, we see that the shape of the graph has not changed,
however it is being translated or shifted horizontally to the left as d
decreases. Notice that, in general, the vertex is still located at ( d,
-2 ).
We've examined positive and negative integers. What about
fractions?
When d > 0 or when d is positive and a fraction
|
|
 |
|
|
|
 |
|
|
|
 |
|

Again, the shape of the parabola has not changed, but
the graph is being shifted horizontally to the right as d increases. The
vertex is also at ( d, -2 ). This is exactly the same as with the positive
integers we explored earlier.
When d < 0 or when d is negative and a fraction
|
|
 |
|
|
|
 |
|
|
|
 |
|

Again, as we expected, the shape of the parabola did not
change. It was simply shifted horizontally to the left as d decreased.
The vertex is still at ( d, -2 ), which parallels with all of the explorations.
Summary
Changing the value of d does not change the shape of the
graph. The value of d results in a change of position horizontally right
when d > 0 and left when d < 0.
Further Explorations
1. Changing the Shape of the Parabola
To change the shape of the parabola, let d = 0 and change
the coefficient of x. In the general equation ![]() , the coefficient of x = 1.
, the coefficient of x = 1.
Let's look at other possibilities.
When the coefficient of x > 0 or x < 0 or when the coefficient is anything but zero
|
|
|
|
|
|
|
|
|
|
|
|
|
|
|
|
|
|
|
|
|
|
|
|

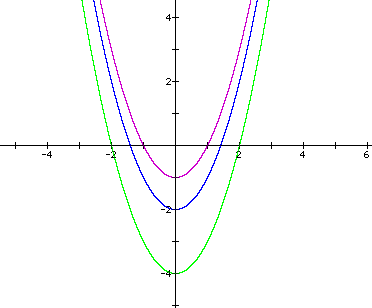
Notice that the graph when the coefficient is 2 and -
2 are the same since they are being squared, thus in the picture the purple
line represents the line when the coefficient is 2 or -2. By
changing the coefficient of x, the position of the graph does not change.
The vertex for all of the graphs is at ( 0, -2 ) since d = 0. However,
the shape of the parabola changes. The graph becomes more compressed or
narrower about the line x = 0 when the coefficient of x > 0 or x < 0.
When the coeffecient of x = 0
|
|
|
|

As we see, the shape of the graph is completely different. We no longer see the parabola; we have a line at y = -2. This should be obvious since everything becomes zero, except for our constant (k) which is -2.
What happens when we change this constant (k)?
2. Vertical Shifts
In the following explorations, we will return to our original equation
![]()
and change the value of our constant (k) from -2 and see
what occurs. ( For this, we will let d = 0 for all explorations.)
When the constant (k) = 0
|
|
|
|

When we changed our constant (k) from -2 to 0, we obtain
a vertical shift. The vertex is no longer at ( 0, -2 ). It is shifted to
( 0, 0 ). Let's look at other cases.
When the constant (k) is greater than zero
|
|
|
|
|
|
|
|
|
|
|
|

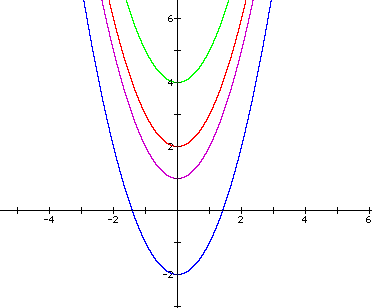
We can see from the graph that as we change the constant
(k), we observe a vertical shift. When the constant is positive, we see
a vertical shift up along the y-axis. In general, the new vertex is located
at ( 0, k ).
When the constant (k) is less than zero
|
|
|
|
|
|
|
|
|
|
|
|

From the graph we can see that when the constant is less
than zero, we get a vertical shift down. The vertex is no longer at ( 0,
0 ), but is at ( 0, k ).
We have explored various facets of the equation ![]()
We have discussed horizontal shifts, changing the shape
of the graph, and vertical shifts. What about inverting the parabola so
that the vertex becomes the maximum rather than the minimum?
3. Inverting/Flipping the parabola
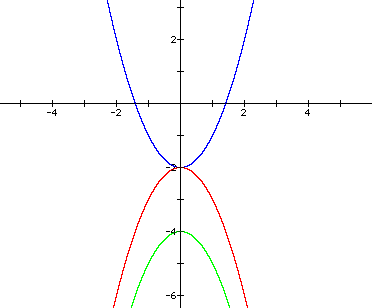
To invert or flip the parabola so that the vertex becomes the maximum instead of the minimum, we simply insert a negative sign in front of the equation. Let's explore this.
|
|
|
|
|
|

By inserting the negative in front of the equation, we
see that the original parabola (blue) now opens downward (red) . The vertex
becomes the maximum as opposed to the minimum and by changing the constant
(k) in the second equation, we get a vertical shift combined with the inversion.