As c changes...
In all previous examples, the value
of c has been 0. How does changing the value of c affect the sine
curve? Once again, let's explore with several examples:

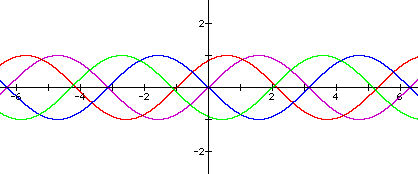
When c=0, the graph of y=sin x passes through
..., x=- , x=-
, x=- , the
origin, x=, x=,....
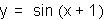
For the graph of y=sin(x+1), c=1. This curve passes through the following
points: ..., x=--1, x=--1,
x=-1, x=-1, x=-1,....
The graph has been shifted or translated to the left by -1 units
along the x-axis.
, the
origin, x=, x=,....
For the graph of y=sin(x+1), c=1. This curve passes through the following
points: ..., x=--1, x=--1,
x=-1, x=-1, x=-1,....
The graph has been shifted or translated to the left by -1 units
along the x-axis.
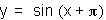
In general, the graph of y=sin (x+c)
translates to the left on the x-axis by c units, if c is positive.
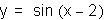
Now, let's consider what happens when
c is negative. From our example y=sin(x-2), we can name the points where the curve crosses
the x-axis. These are: ..., x=-+2,
x=-+2, x=2, x=+2,
x=+2,.... So, the graph appears to
be shifted to the right along the x-axis by 2 units.
In general, if c is negative, the graph
of y=sin (x+c) translates to the right along the x-axis by a distance
of  units.