
Investigate each of the following pairs of parametric equations for t from 0 to 2 pi. Describe each when a=b, a<b, and a>b.

Key:
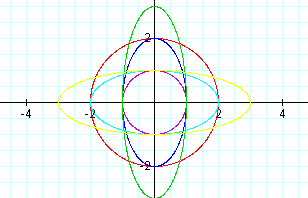
a=1,b=1 Purple a=2,b=2 Red a=1,b=2 Blue
a=1,b=3 Green a=2,b=1 Light Blue a=3,b=1 Yellow
a=b
When a=b, the graph of the parametric equation is a circle. The circles are centered around the origin. As the value of a and b increases from 1 to 2, the circle increases in size. In the first circle, when a and b are equal to 1, the circle extends to 1 and -1 on the x and y-axis. In the second circle, the graph extends to 2 and -2 on the x and y-axis.
a<b
When a<b, the graph changes from a circle to an elliptical shape that is centered around the y-axis. As the value of b increases, the ellipse increases in length but not in width. On the first ellipse, the graph extends to 1 and -1 on the x-axis and 2 and -2 on the y-axis. The x-coordinate is equal to a, and the y-coordinate is equal to b. The same is true for the second ellipse where a=1 and b=3. This ellipse extends to 1 and -1 on the x-axis and 2 and -2 on the y-axis.
a>b
When a>b, the graph has the same elliptical shape as the previous graphs, but the ellipse is centered around the x-axis instead of the y-axis. As a increases, the ellipse again increases in length but not in width. In the first graph, where a=2 and b=1, the ellipse extends to 2 and -2 on the x-axis and 1 and -1 on the y-axis. When a=3 and b=1, the ellipse extends to 3 and -3 on the x-axis and 1 and -1 on the y-axis. In both of these graphs, the x-coordinate is equal to a and the y-coordinate is equal to b.
Conclusion:
Therefore we have seen in the first set of parametric equations that when a=b, the graph is a circle. When a<b, the graph is an ellipse that centers around the y-axis. When a>b, the graph is an ellipse that centers around the x-axis. In all of the graphs, as the value of a and b get larger, the graph increases in size. In all of the graphs, the figure extends to the point on the x-axis that is equal to a and the point on the y-axis that is equal to b. Therefore, we can conclude that this will be true for all values of a and b.

Key:
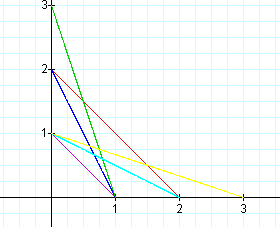
a=1,b=1 Purple a=2,b=2 Red a=1,b=2 Blue
a=1,b=3 Green a=2,b=1 Light Blue a=3,b=1 Yellow
a=b
When a=b, the graph of the equation is a segment that is linear. Its path connects the x and y-coordinate on the x and y-axis that is equal to and b. For example, when a=1 and b=1, the graph connects the points (0,1) and (1,0). The same is true when a=2 and b=2. The graph connects the points (0,2) and (2,0). Therefore, we can conclude that when a and b are equal the graph will be a segment that connects two points on the x and y axis that are equal to a and b.
a<b
When a<b, the graph of the equation is also a linear segment. Also, like the previous graphs, the graph connects two points on the x and y-axis. In each of the graphs, a is equal to the x-intercept and b is equal to the y-intercept. The graph of the segments are not straight across like they were when a=b, but are slanted to where the segment is higher on the y-axis. This is because b is greater, and b gives us our y-coordinate.
a>b
When a>b, the graph is also a linear segment that is slanted just like the previous graphs where a<b. This time the graph is further on the x-axis because a is greater than b. Also, like in the previous graphs a gives us our x-intercept and b gives us our y-intercept.
Conclusion:
In each of the graphs of the parametric equations, the graph is a linear segment that connects two points on the x and y-axis. In each set of graphs, a is equal to the x-intercept and b is equal to the y-intercept. Therefore, we can conclude that this will be true for any values of a and b.

Key:
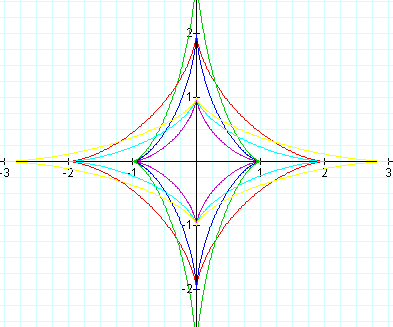
a=1,b=1 Purple a=2,b=2 Red a=1,b=2 Blue
a=1,b=3 Green a=2,b=1 Light Blue a=3,b=1 Yellow
a=b
When a=b, the graph is a inverted square shape where each side is curved inward. In the first graph, where a and b are equal to 1, the graph extends to 1 and -1 on the x and y-axis. When a and b are both equal to 2, the graph extends to 2 and -2 on the x and y-axis.
a<b
When a<b, the graph is a inverted rectangle where each side is curved inward. The graph is similar to the graphs where a=b, except that the graph has been kind of stretched where one side is longer than the other. Both of the graphs where a<b are centered around the x and y-axis and the part on the y-axis is longer than the part on the x-axis. When a=1 and b=2, the graph extends to 1 and -1 on the x-axis and 2 and -2 on the y-axis. When a=1 and b=3, the graph extends to 1 and -1 on the x-axis and 3 and -3 on the y-axis.
a>b
When a>b, the shape of the graph is the same as the graphs where a<b. The difference is that the longer part here is on the y-axis, not the x-axis. This is because a gives us our x-coordinates and is larger than b on each of the graphs. When a=2 and b=1, the graph extends to 2 and -2 on the x-axis and 1 and -1 on the y-axis. When a=3 and b=1, the graph extends to 3 and -3 on the x-axis and 1 and -1 on the y-axis.
Conclusion:
In each of the graphs, we have a kind of inverted box shape that is centered around the x and y-axis. When a=b, the graph is a inverted square shape. When a<b, we have an inverted rectangle shape that is longer on the y-axis because b is larger. When a>b, we have an inverted rectangle shape that is longer on the x-axis because a is larger. On all of the graphs of these parametric equations, a gives us the extension of the graph on the x-axis, and b gives us the extension of the graph on the y-axis.
On all of the graphs of these parametric equations, a gives us the extension on the x-axis of our graph, and b gives us the extension of the graph on the y-axis. We can try the next pair of parametric equations to see if the same is true for its graph.

Key:
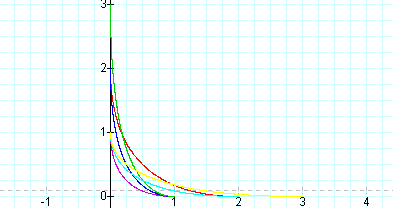
a=1,b=1 Purple a=2,b=2 Red a=1,b=2 Blue
a=1,b=3 Green a=2,b=1 Light Blue a=3,b=1 Yellow
In each of these graphs the same is true for the values of a and b as in the previous graphs. Therefore we can conclude that this will be true for any graph of the parametric equations.