Lets explore parametric equations.
For example if we look at the two equations:
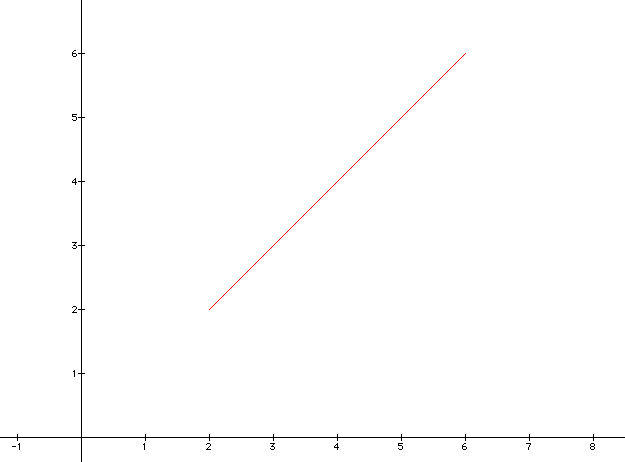
We can examine these graphs for different terms of a, b, and k. Lets first look at the equations if a, b, and k are all equal to 1. When t is between 1 and 5 the graph appears as

Some of the values of the line seem to be the coordinates (2,2), (3,3), ..., (6,6). This would suggest a slope of one. Lets keep exploring...
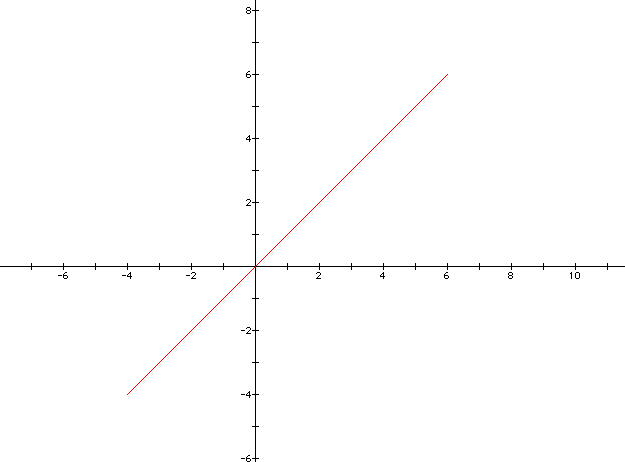
The next step would be to look at a different range for t and to examine how the graphs change. If the graph is set from -5 to 5 the graph appears as:

The difference between the graphs being the distance of the line is longer and includes more values. One might also notice that the graph seems to go through the points (2,2), (3,3), and so forth up to what appears to be (6,6) still. The graph also seems to extend through (-4,-4). The values of a, b, and k have been set to one so it would appear the slope of the line is still one.
From this starting point we can then explore different values of a, b, and k and see if the slope changes. Within each one of this we can also vary our value range of t to see if that changes. The explorations, next will be with grasping the knowledge of several different graphs.
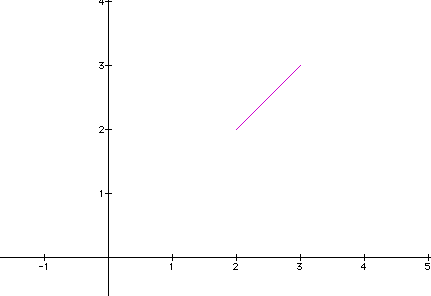
The main point of this write up is to take specific values of a and b and examine how the graphs change varying k and t. If we assume a and b are equal to each other, say a=b=2, we get a graph that appears as: (when k is set to one and t is a range of 0-1)

The line would appear to have a slope still of one, since the two pairs of coordinates are (2,2) and (3,3).
If we now create another equation, hold a and b constant, that uses k=-1, we get an equation that appears as: (where t is still set at a range of 0-1)

Changing k seems to change our slope sine our coordinates are now (2,2) and (1,3).
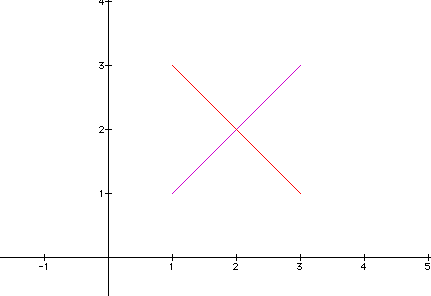
Now lets change our range of t. Lets make it from -1 to 1

We now get our graphs to cross. The graphs also appear to have gotten longer with no change in the original slopes. Our positive slope still has the values (2,2) and (3,3) with (1,1) being an extension. The negative slope still has the values (2,2) and (1,3) and now has (3,1) as an extension.
Now lets examine what happens when:
a and b are different and one is positive and one is negative
Now that we have explored the options of the different graphs it should be clear thathte slope of each graph varied with k. Can we use our equations and manipulate them algebraically to prove this? Click here to see the manipulation.
Now we know that k is the slope and (b-ka) is the y-intercept. Try different equations and explore on graphing calculator. :)