Problem: Squares
Roots Relation (click here to see the problem
statement)
My Solution.
I rewrote the equality to remove some of the radicals:
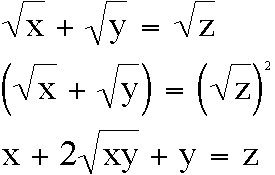
Then, using the "simplified" statement above, I
create a a spreadsheet to look for patterns. I fixed the x-values
and adjusted the y-values. In the tables below, I fixed x at 1,
2, and 3:

| x |
y |
z |
|
x |
y |
z |
|
x |
y |
z |
| 1 |
1 |
4 |
2 |
2 |
8 |
3 |
3 |
12 |
| 1 |
2 |
5.82842712474619 |
2 |
3 |
9.89897948556636 |
3 |
4 |
13.9282032302755 |
| 1 |
3 |
7.46410161513775 |
2 |
4 |
11.6568542494924 |
3 |
5 |
15.7459666924148 |
| 1 |
4 |
9 |
2 |
5 |
13.3245553203368 |
3 |
6 |
17.4852813742386 |
| 1 |
5 |
10.4721359549996 |
2 |
6 |
14.9282032302755 |
3 |
7 |
19.1651513899117 |
| 1 |
6 |
11.8989794855664 |
2 |
7 |
16.4833147735479 |
3 |
8 |
20.7979589711327 |
| 1 |
7 |
13.2915026221292 |
2 |
8 |
18 |
3 |
9 |
22.3923048454133 |
| 1 |
8 |
14.6568542494924 |
2 |
9 |
19.4852813742386 |
3 |
10 |
23.9544511501033 |
| 1 |
9 |
16 |
2 |
10 |
20.9442719099992 |
3 |
11 |
25.4891252930761 |
| 1 |
10 |
17.3245553203368 |
2 |
11 |
22.3808315196469 |
3 |
12 |
27 |
| 1 |
11 |
18.6332495807108 |
2 |
12 |
23.7979589711327 |
3 |
13 |
28.4899959967968 |
| 1 |
12 |
19.9282032302755 |
2 |
13 |
25.1980390271856 |
3 |
14 |
29.9614813968157 |
| 1 |
13 |
21.211102550928 |
2 |
14 |
26.5830052442584 |
3 |
15 |
31.4164078649987 |
| 1 |
14 |
22.4833147735479 |
2 |
15 |
27.9544511501033 |
3 |
16 |
32.856406460551 |
| 1 |
15 |
23.7459666924148 |
2 |
16 |
29.3137084989848 |
3 |
17 |
34.2828568570857 |
| 1 |
16 |
25 |
2 |
17 |
30.6619037896906 |
3 |
18 |
35.6969384566991 |
| 1 |
17 |
26.2462112512353 |
2 |
18 |
32 |
3 |
19 |
37.0996688705415 |
| 1 |
18 |
27.4852813742386 |
2 |
19 |
33.328828005938 |
3 |
20 |
38.4919333848297 |
| 1 |
19 |
28.7177978870813 |
2 |
20 |
34.6491106406735 |
3 |
21 |
39.8745078663875 |
| 1 |
20 |
29.9442719099992 |
2 |
21 |
35.9614813968157 |
3 |
22 |
41.2480768092719 |
| 1 |
21 |
31.1651513899117 |
2 |
22 |
37.2664991614216 |
3 |
23 |
42.6132477258361 |
| 1 |
22 |
32.3808315196469 |
2 |
23 |
38.5646599662505 |
3 |
24 |
43.9705627484771 |
| 1 |
23 |
33.5916630466254 |
2 |
24 |
39.856406460551 |
3 |
25 |
45.3205080756888 |
| 1 |
24 |
34.7979589711327 |
2 |
25 |
41.142135623731 |
3 |
26 |
46.6635217326557 |
| 1 |
25 |
36 |
2 |
26 |
42.422205101856 |
3 |
27 |
48 |
| 1 |
26 |
37.1980390271856 |
2 |
27 |
43.6969384566991 |
3 |
28 |
49.3303027798234 |
| 1 |
27 |
38.3923048454133 |
2 |
28 |
44.9666295470958 |
3 |
29 |
50.6547581061776 |
| 1 |
28 |
39.5830052442584 |
2 |
29 |
46.2315462117278 |
3 |
30 |
51.9736659610103 |
| 1 |
29 |
40.770329614269 |
2 |
30 |
47.4919333848297 |
3 |
31 |
53.2873015219859 |
| 1 |
30 |
41.9544511501033 |
2 |
31 |
48.7480157480236 |
3 |
32 |
54.5959179422654 |
| 1 |
31 |
43.13552872566 |
2 |
32 |
50 |
3 |
33 |
55.8997487421324 |
| 1 |
32 |
44.3137084989848 |
2 |
33 |
51.2480768092719 |
3 |
34 |
57.1990098767242 |
| 1 |
33 |
45.4891252930761 |
2 |
34 |
52.4924225024706 |
3 |
35 |
58.4939015319192 |
| 1 |
34 |
46.6619037896906 |
2 |
35 |
53.7332005306815 |
3 |
36 |
59.7846096908265 |
| 1 |
35 |
47.8321595661992 |
2 |
36 |
54.9705627484771 |
3 |
37 |
61.0713075057055 |
| 1 |
36 |
49 |
2 |
37 |
56.2046505340853 |
3 |
38 |
62.3541565040626 |
| 1 |
37 |
50.1655250605964 |
2 |
38 |
57.4355957741627 |
3 |
39 |
63.6333076527839 |
| 1 |
38 |
51.328828005938 |
2 |
39 |
58.6635217326557 |
3 |
40 |
64.9089023002066 |
| 1 |
39 |
52.4899959967968 |
2 |
40 |
59.8885438199983 |
3 |
41 |
66.1810730128188 |
| 1 |
40 |
53.6491106406735 |
2 |
41 |
61.1107702762748 |
3 |
42 |
67.4499443206437 |
| 1 |
41 |
54.8062484748657 |
2 |
42 |
62.3303027798234 |
3 |
43 |
68.7156333832011 |
| 1 |
42 |
55.9614813968157 |
2 |
43 |
63.5472369909914 |
3 |
44 |
69.9782505861521 |
| 1 |
43 |
57.114877048604 |
2 |
44 |
64.7616630392937 |
3 |
45 |
71.2379000772445 |
| 1 |
44 |
58.2664991614216 |
2 |
45 |
65.9736659610103 |
3 |
46 |
72.4946802489415 |
| 1 |
45 |
59.4164078649987 |
2 |
46 |
67.1833260932509 |
3 |
47 |
73.7486841740758 |
| 1 |
46 |
60.5646599662505 |
2 |
47 |
68.3907194296653 |
3 |
48 |
75 |
| 1 |
47 |
61.7113092008021 |
2 |
48 |
69.5959179422654 |
3 |
49 |
76.2487113059643 |
| 1 |
48 |
62.856406460551 |
2 |
49 |
70.7989898732233 |
3 |
50 |
77.4948974278318 |
| 1 |
49 |
64 |
2 |
50 |
72 |
3 |
51 |
78.738633753706 |
| 1 |
50 |
65.142135623731 |
2 |
51 |
73.1990098767241 |
3 |
52 |
79.9799919935936 |
| 1 |
51 |
66.2828568570857 |
2 |
52 |
74.3960780543711 |
3 |
53 |
81.219040425837 |
| 1 |
52 |
67.422205101856 |
2 |
53 |
75.591260281974 |
3 |
54 |
82.4558441227157 |
| 1 |
53 |
68.560219778561 |
2 |
54 |
76.7846096908265 |
3 |
55 |
83.6904651573303 |
I soon noticed that when x=y on my initial iteration,
the resulting z-value appears to consistently equal the y-value
that will next give an integer value for z, given some fixed value
for x:
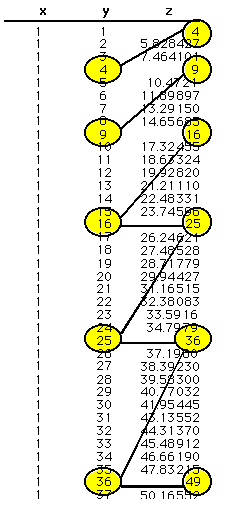
So I constructed another spreadsheet using the resulting
z-value as the input for the succeeding y-value:
|
x |
y |
z |
|
x |
y |
z |
|
x |
y |
z |
|
x |
y |
z |
| 1 |
1 |
4 |
2 |
2 |
8 |
3 |
3 |
12 |
4 |
4 |
16 |
| 1 |
4 |
9 |
2 |
8 |
18 |
3 |
12 |
27 |
4 |
16 |
36 |
| 1 |
9 |
16 |
2 |
18 |
32 |
3 |
27 |
48 |
4 |
36 |
64 |
| 1 |
16 |
25 |
2 |
32 |
50 |
3 |
48 |
75 |
4 |
64 |
100 |
| 1 |
25 |
36 |
2 |
50 |
72 |
3 |
75 |
108 |
4 |
100 |
144 |
| 1 |
36 |
49 |
2 |
72 |
98 |
3 |
108 |
147 |
4 |
144 |
196 |
| 1 |
49 |
64 |
2 |
98 |
128 |
3 |
147 |
192 |
4 |
196 |
256 |
| 1 |
64 |
81 |
2 |
128 |
162 |
3 |
192 |
243 |
4 |
256 |
324 |
| 1 |
81 |
100 |
2 |
162 |
200 |
3 |
243 |
300 |
4 |
324 |
400 |
| 1 |
100 |
121 |
2 |
200 |
242 |
3 |
300 |
363 |
4 |
400 |
484 |
| 1 |
121 |
144 |
2 |
242 |
288 |
3 |
363 |
432 |
4 |
484 |
576 |
| 1 |
144 |
169 |
2 |
288 |
338 |
3 |
432 |
507 |
4 |
576 |
676 |
| 1 |
169 |
196 |
2 |
338 |
392 |
3 |
507 |
588 |
4 |
676 |
784 |
| 1 |
196 |
225 |
2 |
392 |
450 |
3 |
588 |
675 |
4 |
784 |
900 |
| 1 |
225 |
256 |
2 |
450 |
512 |
3 |
675 |
768 |
4 |
900 |
1024 |
| 1 |
256 |
289 |
2 |
512 |
578 |
3 |
768 |
867 |
4 |
1024 |
1156 |
aaa
An Algebraic Representation
 so
so 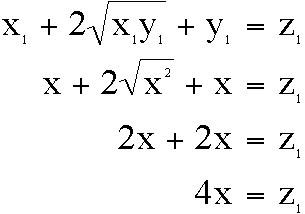 and
and

 so
so 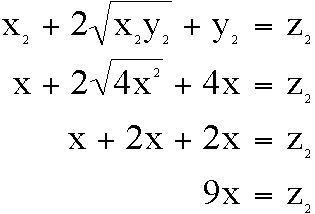 and
and

 so
so 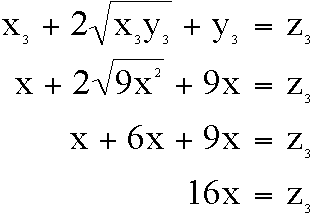 and
and

The pattern of relationships between a fixed x, and
successive y- and z-values is shown in the table below:
n
|
xn
|
yn
|
zn
|
1
|
x
|
x
|
4x
|
2
|
x
|
4x
|
9x
|
3
|
x
|
9x
|
16x
|
4
|
x
|
16x
|
25x
|
5
|
x
|
25x
|
36x
|
We can generalize the relationship as follows:


aaa
A Graphical Representation
If we use the "middle" equation of my
simplified equations given at the top of this discussion >
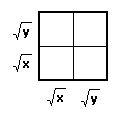
We can construct a graphical representation based
on that equation:
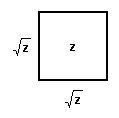 =
= 
IF we assign y = x on the first interation we
have: 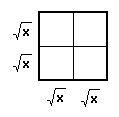 =
= 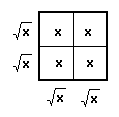 = 4x
= 4x
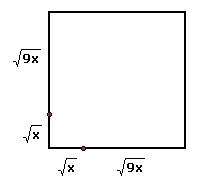
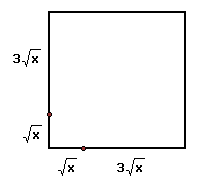
This result for z then becomes the y-value on the next interation:
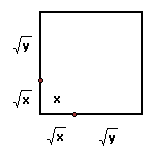 =
= 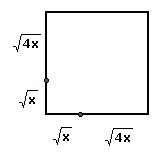 =
= 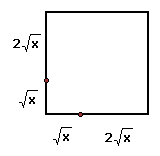 =
= 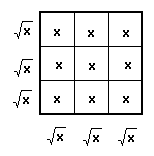 = 9x
= 9x
Again, this result for z becomes the y-value on the next interation:
 =
=  =
= 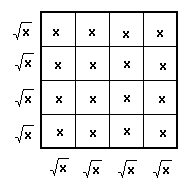 =
16x
=
16x
And so on.


 so
so  and
and
 so
so  and
and
 so
so  and
and

 =
= 
 =
=  = 4x
= 4x =
=  =
=  =
=  = 9x
= 9x =
=  =
=  =
16x
=
16x