
Investigate
In order to investigate this polar equation for various a's, b's, and k's, I'll look at all the different options separately. First, I'll vary a and k, and keep b constant.
In these examples, I have graphed many different values for a on the same graph, so that you can see the effect of a. Then, I have graphed many different versions of this group of graphs for different values of k. B is held constant at 1. Let's look at the graphs:


Let's look at the effect of a first. If k is odd, then a represents the y-intercept. If k is even, then a represents something different. It seems to represent the x-intercept, only not so explicitly. k+1 = x-intercept.
Next, look at the effect of k. k determines the number of "leaves" or loops in the graph. If k is odd, the graph is symmetric about the x-axis and it has k leaves. If k is even, the graph is symmetric about the x-axis and the y-axis. It is also symmetric about the line y=x and y=-x. And again, the graph has k "leaves."
There is one exception to the rule above: that k=number of leaves. Look at the instances hen a is 0. If a is 0 and k is odd, then the rule still applies. But, if a is 0 and k is even, then the number of leaves is 2k.
Next, I'll look at the graphs if a=b and k is a constant. I'll vary k, then I'll look at the set of graphs if a=b.


As you can see, if a=b, and k is constant, then you have hat is called the "n-leaf rose" or in our case, the "k-leaf rose" All of these graphs come back to the origin beteen loops.
One last investigation that I'd like to do is to vary b. I'll set a and k to be constant.


You can see that there appears to be more than one of some of the graphs in each set. You can see though that b helps to tell us the number of graphs. The ay that it does that is to tell us the x-intercept(s). b+a and b-a are the x-intercepts. If b-a>0, then there are 2 of those graphs!
Investigate
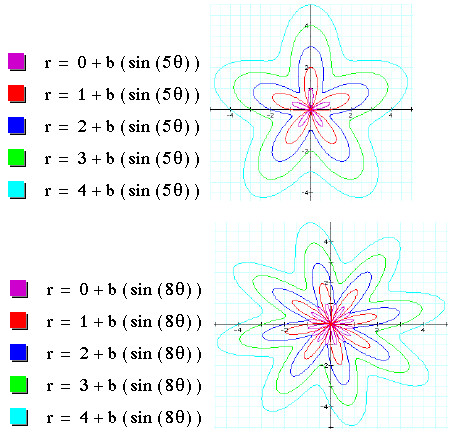
I am going to do the exact same investigation as I did for cosine. By doing this, I can investigate the change of the graphs as a, b, and k vary, and I can also investigate the difference in sine and cosine.
Let's start by varying a and k, and letting b stay constant at 1.


From the graphs above, I can see that these are the exact same graphs as the cosine graphs, except they have a little "tist" to them. If k is odd, then the graphs have been rotated 90 degrees. If k is even, then the graphs have been rotated 45 degrees.
If you vary a, b, or k, this ill still be the case every time. The graphs are the exact same as the cosine graphs, only they are rotated to some degree, specifically 90 degrees if k is odd and 45 degrees if k is even.