
Some Different Ways to Examine
ax2 + bx + c = 0
By
James
W. Wilson and Audrey V. Simmons
University of Georgia
It has now become a rather standard exercise, with available technology, to construct graphs to consider
the equation ax2 + bx + c = 0. We will be looking at some of the relationships that exit in the world of parabolas.
PART I
Our starting point becomes y
= ax2 + bx + c
For a = 1, c = 1 our equation is y = x2 + bx + c. We will vary b.
Let -3![]() b
b ![]() 3
3
y= x2
+1 y= x2 + 1x +
1 y=
x2 +2x +1 y= x2
+3x +1 y= x2 -1x +1
y= x2 –2x + 1 (Yellow) y= x2 –3x + 1 (gray)
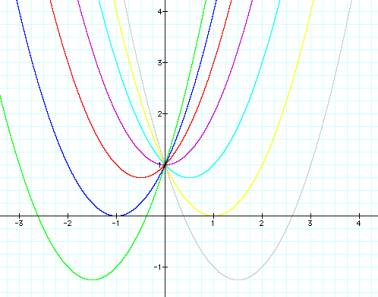
We can see that all of the
graphs have a y-intercept of (0,1).
Would we have a y- intercept of 3 if c=3 and the equation was y=x2 + bx +3 ?
Click HERE to
see if there is a common y-intercept.
Would the same be true when a=2 and c=3
for y= 2x2 +bx + 3?
Click HERE
to see.
Surprise! No matter what the coefficients of a or
b, the value of c tells
us what the y-intercept is. There
is a movement of the parabolas through the same point on the y-axis.
Please look back at the
original graphs above. At the
points where b=2 and b= - 2 the graphs are tangent to the x- axis. Recall that
the roots of the equation indicate where the graph touches or crosses the x
-axis.
The roots of the equations
are as follows:
y
= x2 +1
no roots
y
= x2 + x + 1
no roots y
= x2 -1x + 1 no roots
y
= x2 + 2x + 1 one
root y
= x2 -2 x + 1 one
root
y
= x2 + 3x + 1 two
roots y
= x2 -3 x + 1 two
roots
When b> 2, there are two
negative real roots. When b<-2,
there are two positive real roots.
When –2< b < 2, there are no real roots.
PART II
Is the locus of the vertices
of a set of parabolas a parabola?
Look at the black graph
of y = -x2 +1. It appears to travel through the
vertices of each parabola.
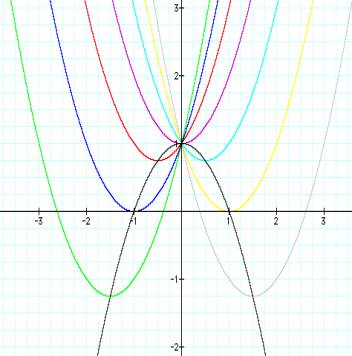
If we found the vertices of
each of the graphs, they would be solutions for the equation y = -x2 +1
PART III
Consider the same equation x2
+bx +1 = 0. We will graph this
equation in the xb plane. That means we will solve for b instead
of y giving us the equation
b = ![]() or b =
or b = ![]()
x will still be found on the horizontal axis and b will be found on the “y” axis.
What are the roots of the
graph? Our quadratic equation x2 +bx +1 = 0 graphs as a hyperbola.
When b = 2 or b =
-2 we have one root at the vertex of the hyperbola. When b = 3
we have 2 negative roots. Therefore, for all values of b > 2, there are 2
negative roots. When b < -2, there will be 2 positive roots.
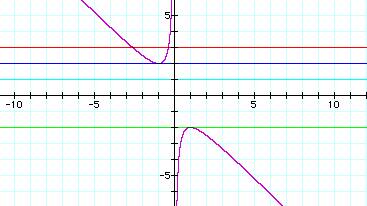
When c =-1, values less than
–1 approach a diagonal asymptote and the vertical axis.
PART IV
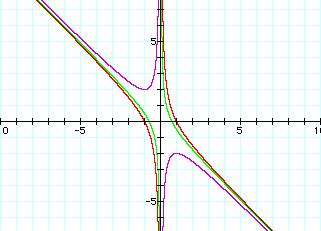
This time we will graph our
equation in the xc plane. Our equation is
x2 + 5x +c =
0 or c = -x2
– 5x
This will be the graph of a
parabola. In the graph below x is represented on the horizontal axis and c is represented on the vertical axis.
x2 +
5x +c = 0 is our parabola
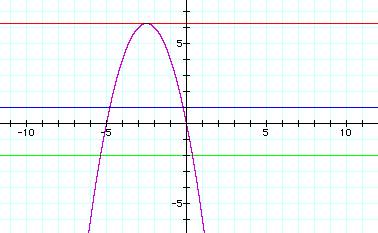
c = 6.25 shows
one root
c> 6.25 shows no roots
c=1 shows two negative roots
c
= 0 shows one negative root and one root of zero
c = -2 shows one positive and one negative root
To summarize when c < 0 there are two roots, one is positive and one is negative. When c = 0, one root is negative and one is zero. When 0< c < 6.25, there are two negative roots. There is only one root when c = 6.25.