
Try several graphs of ![]() on
the same axes. (i.e., use different values of a).
on
the same axes. (i.e., use different values of a).
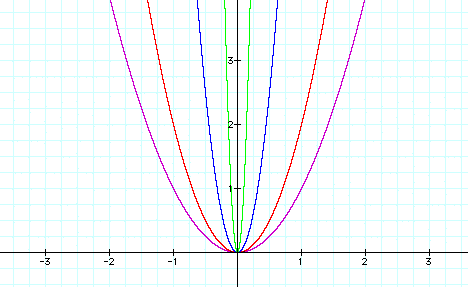
By choosing several positive values of a and graphing the equations, we get the following parabolas which all have the vertex (0,0) and open upward. Notice that as |a| increases, the parabola gets skinnier.

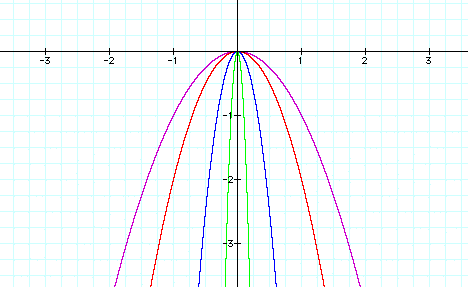
Now choose several negative values of a. Again all the parabolas have a vertex of (0,0). They are now just flipped across the x-axis and open downward. Like above, notice that as the |a| increases, the parabola gets skinnier.

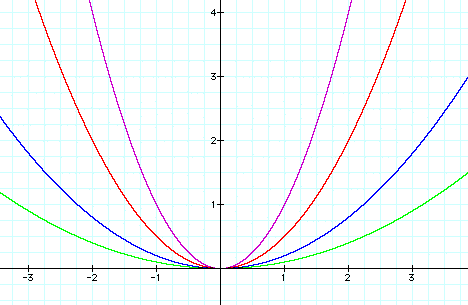
Now consider several smaller values of a such as when a is between 0 and 1. We know that when a=0, the graph will be the x-axis. So using the values 1/2, 1/5, and 1/10 we see that as the values of a get smaller, the parabola gets wider or more spread out.

If a>0, the parabola opens upward.
If a<0, the parabola opens downward.
If a=0, the graph is the x-axis.
As |a| gets smaller, the parabola widens or becomes more spread out.
As |a| gets larger, the parabola becomes skinny.
Return to Emat
6680