Investigating
![]()
Write-up by
Blair T.
Dietrich
EMAT
6680
Part I.
![]()
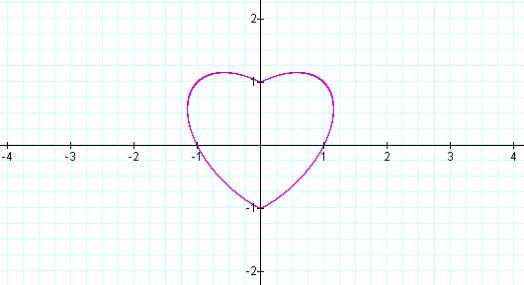
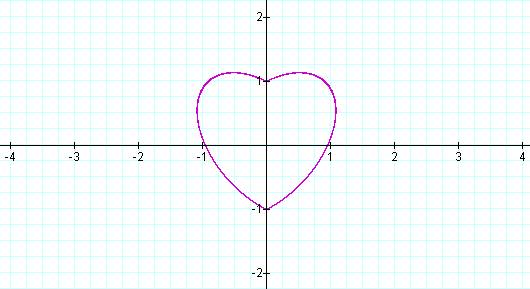
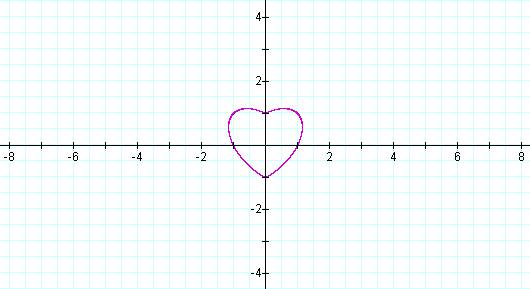
This equation yields some surprising results as the coefficient of y|x| is changed.
When a=1 the graph appears heart-shaped. This is equivalent to the original form of
the equation
![]()
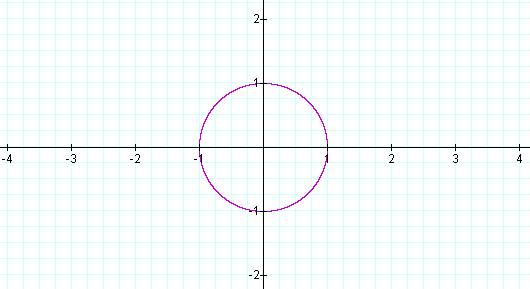
When a=0, the unit circle appears…
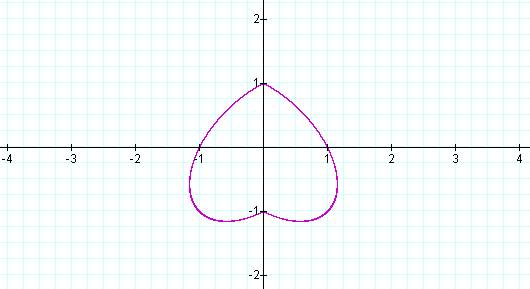
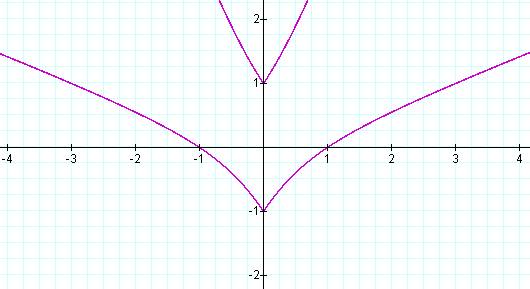
When a= -1, it's an upside-down heart…
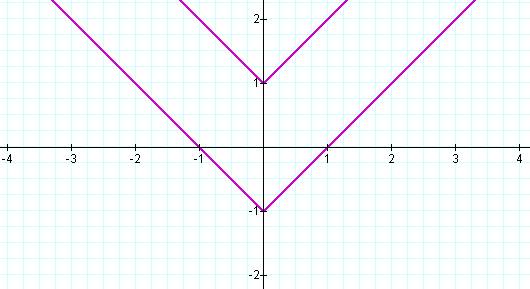
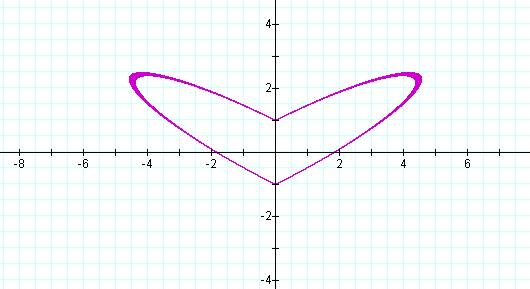
When a = -2, parallel absolute value graphs appear…
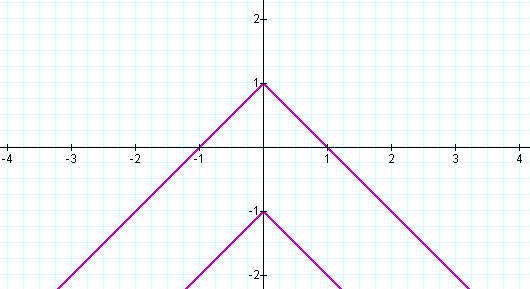
When a = -3, the lines "warp"
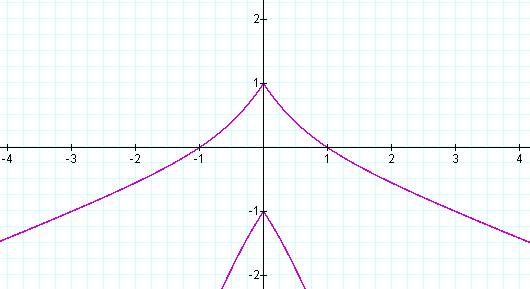
Similarly, when a = 2 and a = 3, respectively, the graph shows parallel absolute value graphs and warped lines in the opposite direction.
Part II.
What if the coefficient of x^2 changes?
Consider the graph of the relation shown below:
![]()
When a = 1, the equation (and, hence, the graph) is the same as that of
![]()
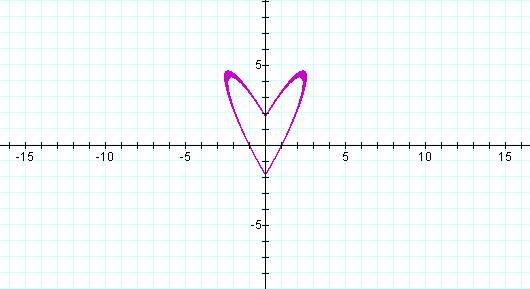
As a gets smaller, the heart dilates…(here, a = 0.3)
But when a = 0.2, the heart "breaks"…

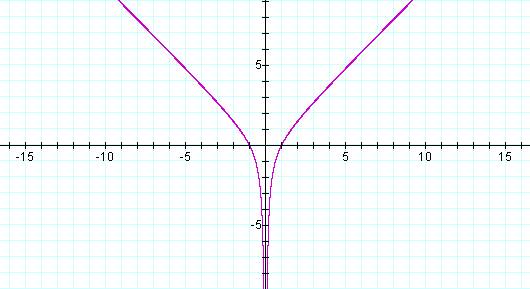
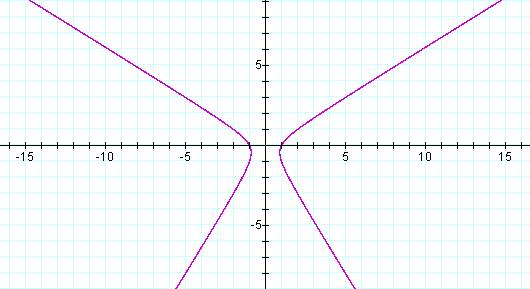
Eventually, the pieces bend away from each other…(a = -3 shown)

For a > 1, the "heart" just gets more compressed horizontally (a = 3 shown)

III.
Just as easily adjusted is the coefficient of y^2.
Consider the graph of the relation shown below:
![]()
Again, when a = 1 the equation (and, hence, the graph) is the same as that of
![]()
As a gets smaller, the heart dilates before splitting apart:
(a = 0.3)
(a=0)
(a = -1)
Return
to Blair Dietrich's
EMAT 6680
page