Investigations with polar
equations
Write-up by
Blair T. Dietrich
EMAT 6680
Assignment #11 Investigation #2
How
does the graph of ![]() change
as a varies?
change
as a varies?
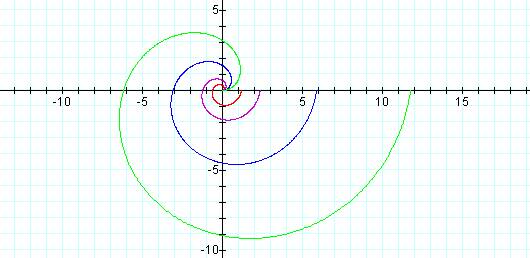
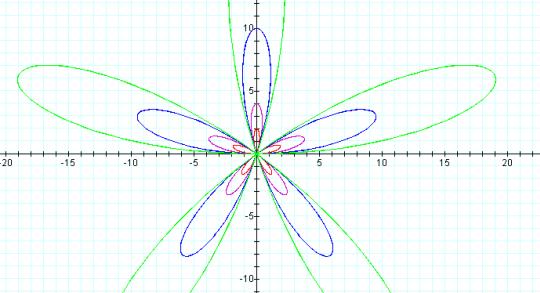
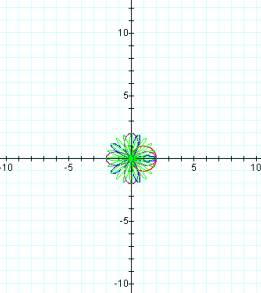
Here k = 0.1
Larger values of a tend to make the spirals grow in "width" and in "length."
How
does the graph change as k varies?
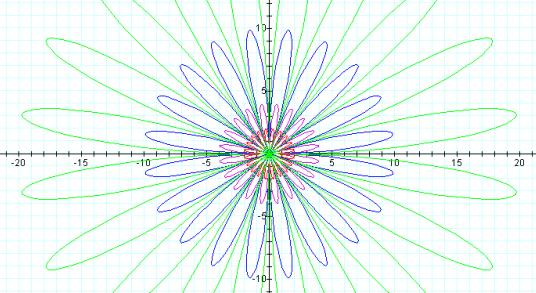
Keeping all a values (and colors) as shown above, we can see the affect that the value of k has on the graph:
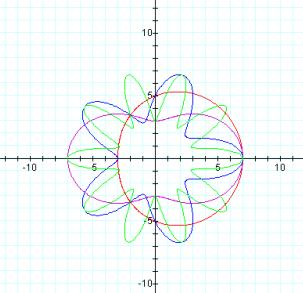
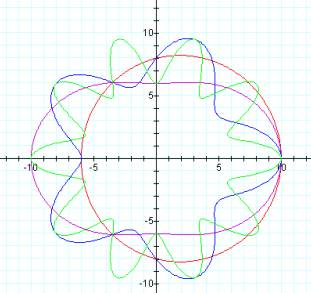
For k = 1…
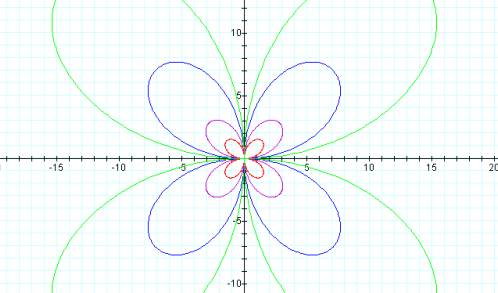
For k = 2…
For k = 5…
For k = 10…
Try
your own value of k here.
What
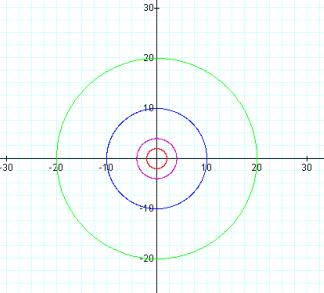
about the graph of ![]() ?
?
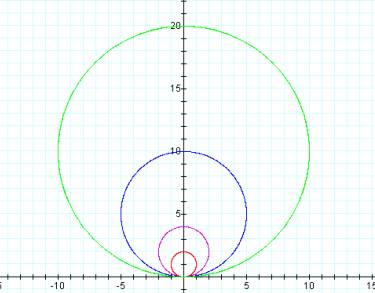
For k = 0 we have nice concentric circles… For k = 1, the circles are nicely tangent at (0,0)…
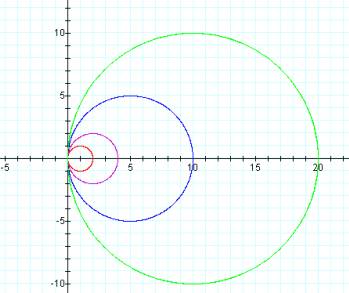
For k = 2…
For k = 5…
For k = 8…
Try
your own here.
How
is the graph affected when a constant b is added to either of the
previous equations?
Consider the graph of ![]() for
various values of b:
for
various values of b:
b = 0 b
= 3
b = 6 b
= 9
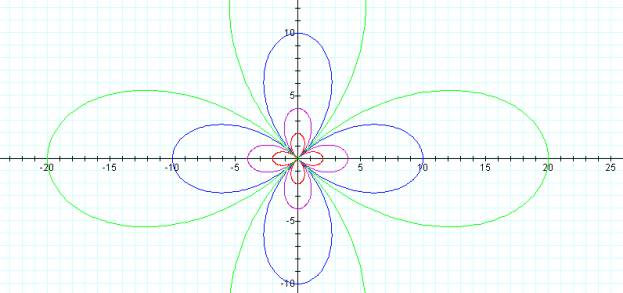
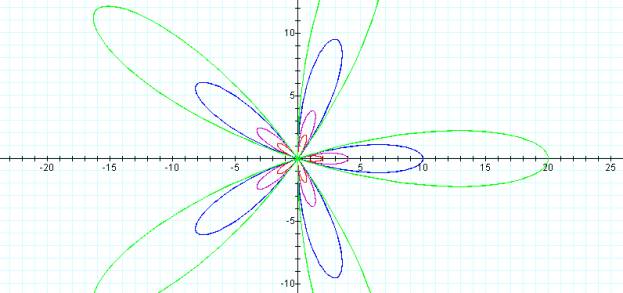
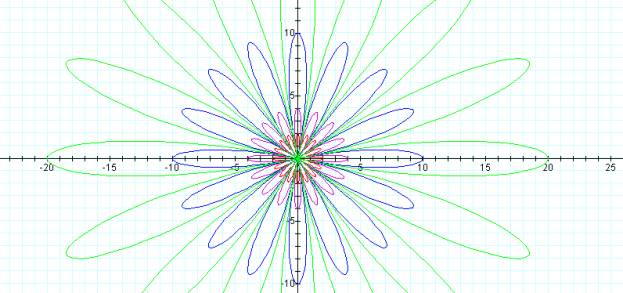
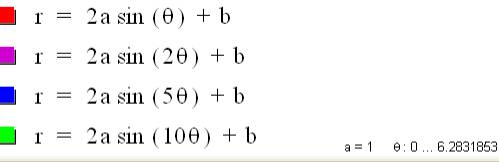
Now consider the graph
of ![]() for various values of
b (the color scheme is the same as for that above):
for various values of
b (the color scheme is the same as for that above):
b = 0 b
= 3
b = 5 b
= 8
In each case it appears that adding the constant b
yields a dilation in the graph.
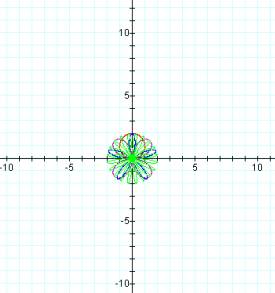
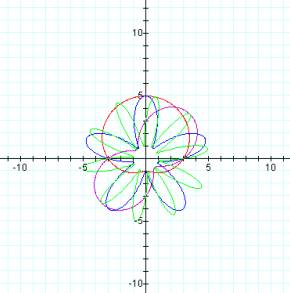
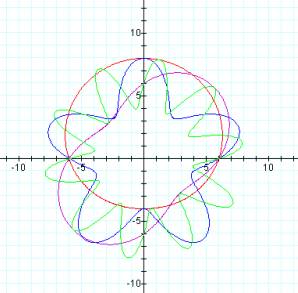
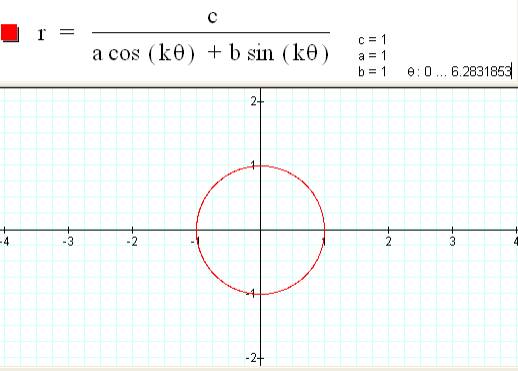
Lastly, let us consider the equation ![]() .
.
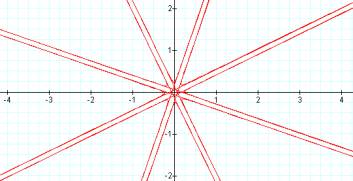
Keeping the values of a, b, and c constant (here a=b=c=1), we can change k to see its affect on the graph.
For k=0, the unit circle is graphed:
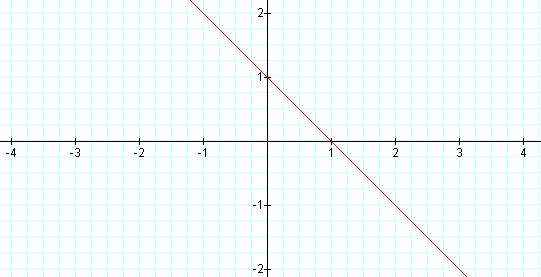
For k=1, the line y = -x + 1 is graphed.
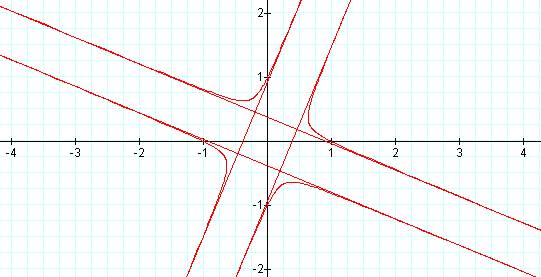
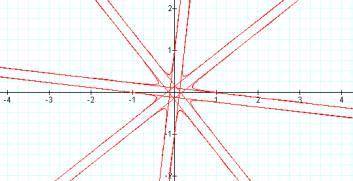
k=2:
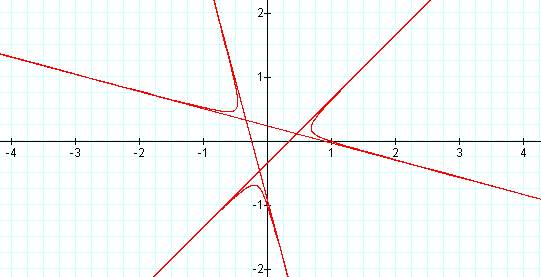
k=3:
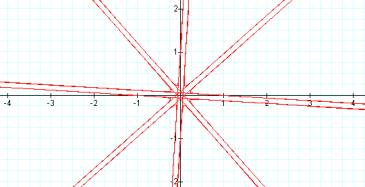
k=4:
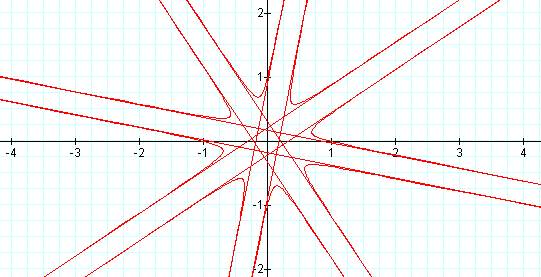
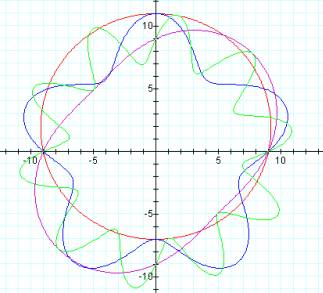
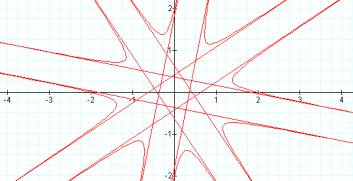
As k
increases in magnitude, the number of "branches" increases.
Experiment with your own values of k here.
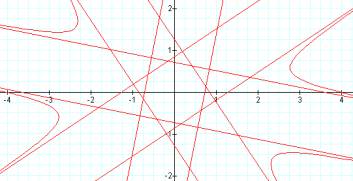
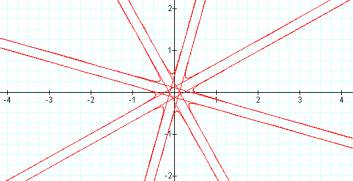
Now (while holding k=4) we will consider how changes in a, b, and c affect the graph.
c=2 c=4
As c increases, the graph is dilated from the center and the graph intersects the axes at the c-values.
a=2 a=4
As a increases, the graph is shrunk toward the center. The intercepts appear to be 1/a on each axis.
b=2 b=4
As b increases, the asymptotes to the curve get closer together. The intercepts are unchanged.