Assignment 12
Using Spreadsheets
Page Bird
1.
Construct a graph of any function y = f(x) by generating a table of values with
the x values in one column and the y values in another.
For this assignment, I to chose to use two equations:
![]()
![]()
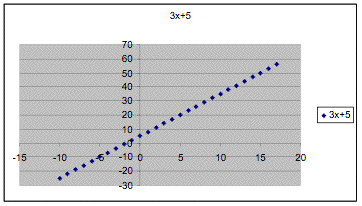
Using excel, I plug the first formula into the equation:
|
x |
3x+5 |
|
-10 |
-25 |
|
-9 |
-22 |
|
-8 |
-19 |
|
-7 |
-16 |
|
-6 |
-13 |
|
-5 |
-10 |
|
-4 |
-7 |
|
-3 |
-4 |
|
-2 |
-1 |
|
-1 |
2 |
|
0 |
5 |
|
1 |
8 |
|
2 |
11 |
|
3 |
14 |
|
4 |
17 |
|
5 |
20 |
|
6 |
23 |
|
7 |
26 |
|
8 |
29 |
|
9 |
32 |
|
10 |
35 |
|
11 |
38 |
|
12 |
41 |
|
13 |
44 |
|
14 |
47 |
|
15 |
50 |
|
16 |
53 |
|
17 |
56 |
Next, using the chart function, I graphed the numbers to get this graph:
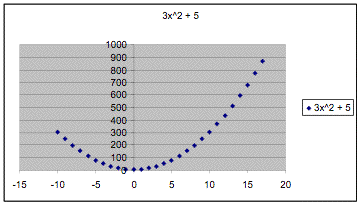
The other table looked like:
|
x |
3x^2 + 5 |
|
-10 |
305 |
|
-9 |
248 |
|
-8 |
197 |
|
-7 |
152 |
|
-6 |
113 |
|
-5 |
80 |
|
-4 |
53 |
|
-3 |
32 |
|
-2 |
17 |
|
-1 |
8 |
|
0 |
5 |
|
1 |
8 |
|
2 |
17 |
|
3 |
32 |
|
4 |
53 |
|
5 |
80 |
|
6 |
113 |
|
7 |
152 |
|
8 |
197 |
|
9 |
248 |
|
10 |
305 |
|
11 |
368 |
|
12 |
437 |
|
13 |
512 |
|
14 |
593 |
|
15 |
680 |
|
16 |
773 |
|
17 |
872 |
And the
graph looks like:
Click here to see the excel file.
EMAT
6680 Class Page for Page Bird