

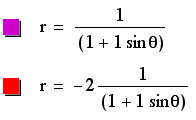
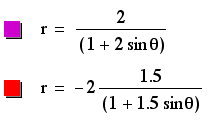
As in the other three types of equations explored in this study, these equations produce parabolas when k is equal to one. A negative p-value causes the graph to open up but with a negative vertex. A positive p-value causes the graph to open down with a positive vertex. Again, p determines the amount of stretch, with a larger p-value indicating a wider graph.
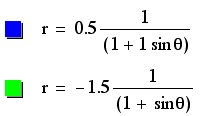
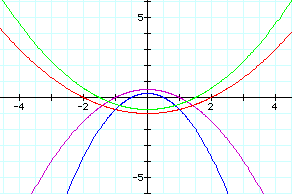
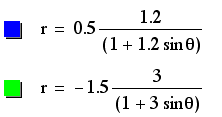
These equations are of the hyperbolic form with visible assymptotes. The vertex depends on p, so when p is positive the vertex is positive, and when p is negative the vertex is negative. As k gets larger, the graphs approach the elliptical shape, but since p affects the stretch of the graphs, it can counteract the effects of k. The graphs, therefore, show a wide assortment of stretch and height for the different values of p and k.
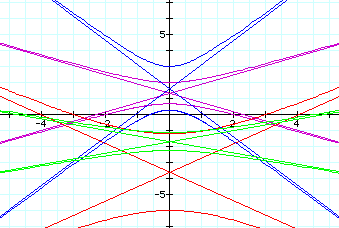
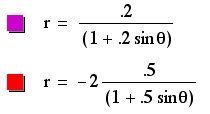
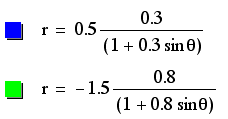
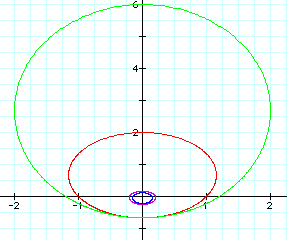
These ellipses look similar to those explored earlier in this study. (To see those, select the third equation at the opening page instead of the fourth, which is this page.) The difference is that these ellipses expand into the positive y portion of the coordinate plane, while the graphs mentioned above extended into the negative y portion of the coordinate plane. This must be due to the positive sin instead of negative sin, which means that the sign of k directly effects the direction of expansion. Both p and k effect the heighth and width of these ellipses, with larger values of k causing the graphs to approach the parabolic form present when k=1, which acts as the transition between k<1 and k>1. These effects, however, are sometimes cancelled out by large values of p which effect the size of the ellipses. WE can now see that the placement of the center is not dependent upon the sign of p or k, because all of the centers represented here are positive.
