Mathematics Education

y = cos x
by
To examine the graph of y = cos x, I will examine y = A cos (Bx + C) for different values of A, B, and C. This will allow me to make generalizations for the effects of changes in parameters A, B, and C and thus I will know how to graph a function y = Acos(Bx + C) quickly.
[Instructor's comment: The goal these days is probably not "how to make a graph . . . quickly." We have technology that will do equation driven graphs of any complexity quite quickly. Rather the goal is to understand the impact or effect of each of the parameters and to be able to describe them in mathematical terms.]
Let us first look at the graph y = cos x. This is where A = 1, B = 1, and C = 0. This is the "parent" cosine graph that we will compare to other graphs. The parameters A, B, and C transform the graph to related graphs.

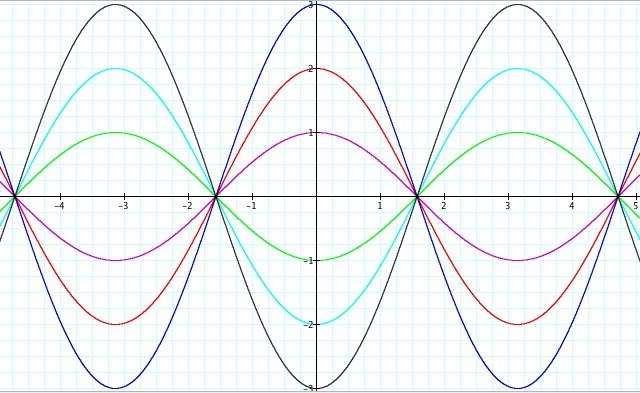
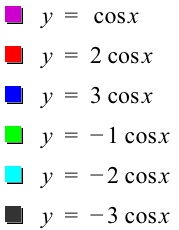
Now, let us change the values of A. Multiple graphs are produced on the same axes, with A = 1, 2, 3, -1,-2, and -32. In all of these cases B = 1 and C = 0.


The differences shown in the graphs above show the graphs change as the value of "A" in y = A cos x changes. The "A" is a scalar multiple of our function. For any f(x) the value of Af(x) changes the size and is thus a similarity transformation. We define |A| in this circular function to the Amplitude of the curve. It is one half of the peak to peak variation of the curve and is given by the equation

The sign of A is of special importance. Notice that the last three graphs show negative values for A.The -1 times the amplitude acts as a separate scalar multiple and is a reflection in the x-axis.
Now let us change the values of B.


It appears that B affects the period of the curve. To see if this is true, lets graph some curves where the value of B is less than zero.

We can see that in fact, B does affect the period of the curve. It takes 1/B times to complete a period of a curve. If B is equal to 1, then it takes 2pi to complete a period. If B is equal to 2, then it takes only pi to complete a period. If B is equal to 1/2, then it takes only 4pi to complete a period, twice as long as a normal period. Once again we also see that a negative only reflects the curve about the x-axis.
Now let us change the values of C. It is easy to characterize the effect of changes in C as a mapping (x, y) to (x + C, y) and this is a translation either moving the graph to the left if C is positive, or to the right if C is negative. The translation is a mapping that preserves distance and so the image curve is congruent -- there is no change in the shape or the size of the curve.

Automatically we can see that the actual picture of the graph does not change, it only shifts. If C is positive it shifts to the right, if C is negative it shifts to the left. Thus C affects the horizontal displacement (or shift) of the graph.
[Instructor's comments: The language of "shift" is problematic. It begs for mathematical definition. The "shift" we describe is a visual perception. We attribute motion to something where we may not be sure what is moving. For instance, does the "graph" of y = cos x move or do we move our perspective to a new set of axes? Furthermore, with circular functions, if C = 2nπ then the translation maps the curve onto itself.]