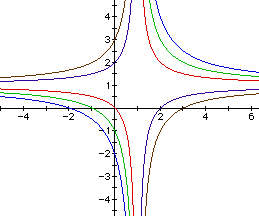
So from this we see that changing the value of c moves the hyperbolas
up and down on the graph. Also when the value for c is negative, the hyperbola
changes the axis of symmetry.
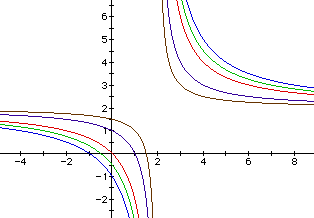
If we change a = b = 2 and vary c again, we produce very similar graphs
except the axis of symmetry does not change.
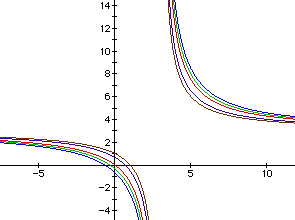
If we change a = b = 3 and continue to vary c, we produce this family of curves.
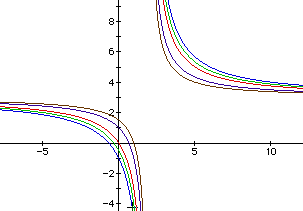
What would happen if we did not have a = b? In this case, a is greater than b . Do you see any differences between this one an the other graphs?
From these graphs we can see that the equation