
Our problem is stated to begin with two linear functions. Our goal is
to find their product such that when they are graphed on one coordinate
plane the product [h(x)] is tangent to f(x) and g(x) at two different points.
Because we are investigating the relationship between two linear functions
and their product it is reasonable to begin with very basic linear functions.
We can then use the information learned at each step to reach our ultimate
goal.
To start pick the very simplistic of linear functions

Because the slope of each linear function is the same our lines will
run parallel to each other. We can assume that the product of f(x) and g(x)
therefore will not touch the lines at only two distinct points.

As you can see the function h(x) crosses the linear functions at its roots
0 and -1. It also crosses the linear function f(x) at the point (1,2).
Our next step may be to change the slope of one of the linear functions.
Therefore, the lines will not run parallel, but they will intersect each
other at one point. Again, I am going to begin at a basic level graphing
the functions
Before looking at the graph, we can see that there is going to be a relationship
between the linear functions that have been chosen. The opposite slopes
will give us two linear functions that are perpendicular to each other when
graphed.


This will produce a parabola that opens downward from the origin. Will
it be tangent to f(x) and g(x) at two distinct points?

As you can see the function h(x) is not tangent to f(x) and g(x) at only
two distinct points. We can see that our goal does not seem far from us
at this point. If it were possible to move our parabola down below the point
of intersection of f(x) and g(x) we will be even closer. To investigate
this idea of moving the parabolar "down" on the graph we should
take a moment to look at what is happening when we multiply our linear functions.
Let's investigate one more pair of linear functions in order to observe
the relationship between their intersection point and h(x). We should continue
to use linear functions whose slopes are opposite.
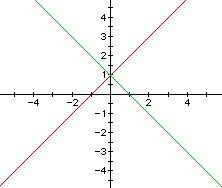
I am going to choose the linear functions f(x) = x + 1 and g(x) = - x +
1 so that they will intersect at a point above the origin on the y-axis.
We can determine this point from the given information. If we substitute
zero in for the value of x, we can identify the y-intercept of any linear
function. In this case substituting zero in f(x) and g(x) gives us a y-intercept
of 1.

Before we graph the product of f(x) and g(x), let's observe some characteristics
of h(x) algebraically.
The negative coefficient of the first time of the parabola tells us that
the parabola will be opening downwards. Substituting zero in for the value
of x we will be able to find the y -intercept.
Substituting in zero for the value of y [h(x)] we will be able to find
the x-intercept.
Looking at the graph will illustrate what we have determined algebraically.

Our investigation continues as we try to determine a way to "move"
the parabola down below the point of intersection of the linear functions.
Again, let's visit this algebraically. Let f(x) = ax + c and g(x) = bx +
d. We can determine the equation for h(x) by multiplying the two together.
To find the y-intercept of h(x) we can substitute zero in for x. The
resulting point would be cd. If we look at where f(x) and g(x) would cross
the y-axis we would find their y-intercepts at (0,c) and (0,d) respectively.
Therefore, in order for the graph of the parabola to be "lower on the
graph" than the linear functions, cd needs to lie on the y-axis below
the intercepts c and d.
As we continue to choose functions for f(x) and g(x) we need to keep this
in mind. Let's modify the equations that we had used before.
Our last graph had f(x) = x + 1 and g(x) = -x + 1. To create a parabola
that is below the intercept, let's replace the constants c and d with the
value of 1/2.


Because the range on our graph has the x and y minimums at -10 and 10,
our picture is difficult to observe. Patterns may not be easily recognized
and usable. Let's change our range for a closer look. I have chosen a range
of -2 and 2.

This should be able to give us a closer look and a better understanding
of the graphs.


It is difficult to examine the points of tangency due to computer limitations. Another way to determine the points of tangency for any equation is to look at its derviative.
