www.john-weber.com
Chapter 2: Examining Relationships
Section 2.2: Correlation
Linear relationships between two variables are important because a stright line is a simple
pattern that is common. How close a scatterplot approaches a line depends on the scales of the
axes.
The correlation r
Measures the strength and direction of the linear association between two quantitative
variables.
The correlation coefficient can be calculated using
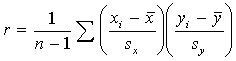
where xi and yi are the observations of one individual, sx
is the standard deviation for the x variable and sy
is the standard deviation for the y variable. Also, the factor  standardizes all
the x observations and the factor
standardizes all
the x observations and the factor  standardizes all
the y observations. These two factors are multiplied for each individual then summed over all individuals.
Lastly, the sum is divided by the factor n – 1.
standardizes all
the y observations. These two factors are multiplied for each individual then summed over all individuals.
Lastly, the sum is divided by the factor n – 1.
Luckily, here are steps to find the correlation coefficient using the TI-83 calculator.
Facts about correlation
- Correlation makes no distinction between explanatory and response variables.
- Both variables MUST be quantitative.
- Units of measurement do not affect r. Also, r has no units.
- Positive r indicates positive association between the two variables. Negative r
indicates negative association between the two variables.
- r is always between –1 and +1. Values near 0 indicate a very weak linear
relationship. Values near –1 or +1 indicate that the points in a scatterplot lie close
to a straight line. Extreme values of ±1 occur only when the points lie exactly along a
straight line.
- Correlation measures only the strength of linear relationship between two variables. It
does not describe curved (i.e., quadratic, exponential, logarithmic, etc.) relationships.
- Correlation is not resistant to outliers. Use r with caution when there are possible outliers.
IMPORTANT: Correlation is not a complete description of two–variable data. You should also include the means and
standard deviations of each variable.
Back to John Weber's MATH 1431 Page
Back to john-weber.com