| Steps |
Key Sequence |
Screens |
| 1. Enter sample 1 data into list, L1 |
|
|
| 2. Enter sample 2 data into list, L2 |
|
|
| NOTE: You can enter 2 to 20 samples (i.e., lists) for the ANOVA F test. |
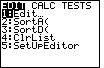
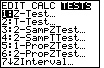
| 3. Set up Stats Tests |
STAT |
 |
| |
 twice twice |
 |
| |
ALPHA, then COS (for ANOVA) |
 |
| 4. Enter Lists, separated by commas |
2nd, then 1 (L1), etc., then right parenthesis |
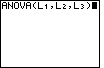 |
| 5. Calculate |
ENTER |
 |
| 6. Scroll down to find more calculations |
Press  once once |
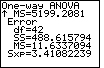 |
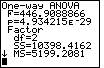
| In this case, the F statistic is 446.909, the P–value is
4.93 × 10 –29 (essentially zero), etc. df is degrees of freedom,
SS is sum of squares, MS is the mean square. |