| Steps |
Key Sequence |
Screens |
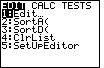
| 1. Set up Stats Tests |
STAT |
 |
| |
 twice twice |
 |
| |
5 (for 1–PropZTest...) |
 |
| 2. Input 'test' proportion |
enter value for p0, then ENTER |
 |
| 3. Input number of successes, x |
enter value for x, then ENTER |
 |
| 4. Input number of observations in SAMPLE, n |
enter value for n, then ENTER |
 |
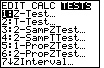
| 5. Select appropriate test |
use right and left arrow keys to move cursor to appropriate test, then ENTER |
 |
| 6. Calculate P–value |
 once, then ENTER once, then ENTER |
 |
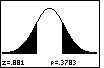
In this case, the test was Ha: p ≠ 0.5; the one–sample
z statistic is 0.8810; the p–value is 0.3783;  is 0.5069
and n is 4040. is 0.5069
and n is 4040. |
| 7. Draw the test |
repeat steps 1 through 6 (the data should already be stored!), then
once, then ENTER |
 |