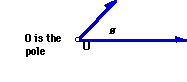
An equation for a curve given in terms of r and ø is called a polar equation. When first exploring polar equations is it helpful to graph by hand using polar coordinates to obtain a understanding of why the curve appears as it does. Like Cartesian coordinates polar coordinates have two values, Theta (ø) and r. Theta is the measure of the angle in standard position measured counterclockwise from the polar axis, and r is the directed distance from the pole to the point P in the plane. The position of a point P in the plane can be described by giving its distance r from a point O called the pole. (See diagram below)
It is customary to let the pole coincide with the origin in a Cartesian coordinate system, and to let the polar axis coincide with the positive x axis. The typical notation for polar coordinates is (r; ø), however, ø is the independent variable.
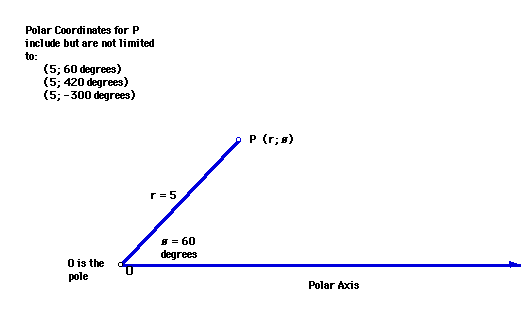
A single point may have many pairs of polar coordinates since there can be an infinite number of coterminal angles passing through any given point. For example the diagram below can indicate any of the following polar coordinates and many others as well.
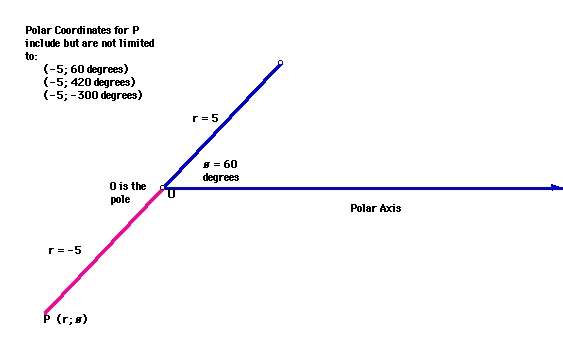
Since r is a directed distance r can be a negative number. If r is a negative number the point (r;ø) is plotted as ( | r | ; ø + pi). That is if r < 0 measure the angle ø as usual, then go in the opposite direction from the ray normally drawn. See an example below.
It is recommended that students practice graphing polar coordinates and some of the simple curves to familiarize themselves with how the curve is formed. After a basic understanding of polar coordinates is reached the use of technology allows the student to make generalizations from many cases. For this investigation we will look at polar equations using MacNumerics> Polar Equations software. We will examine the effects of changing certain parameters in the general equation
r = a + b cos (k t). Our investigation will include exploring graphs when a = b, a< b and a> b while k varies. We will look at how k affects the graph when it varies, how the radius changes based on the equation and how the loops or petals are formed.
First we will look at the following:
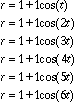
MacNumerics will allow us to look at two of these curves at once to contrast
and compare what is happening to the curve as we change the equations. First
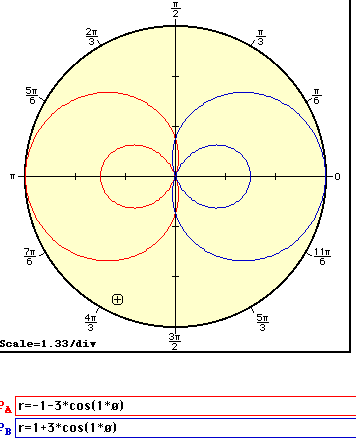
we will look at ![]()
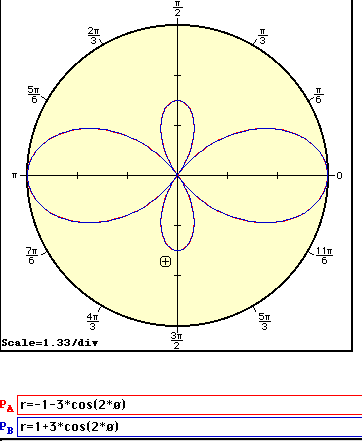
Next we will examine ![]()
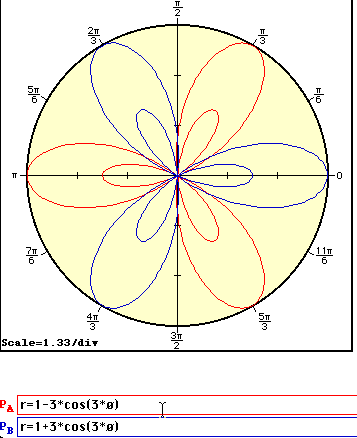
Finally we will compare ![]()
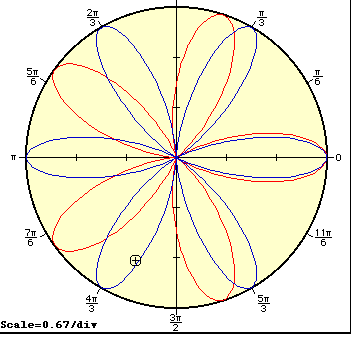
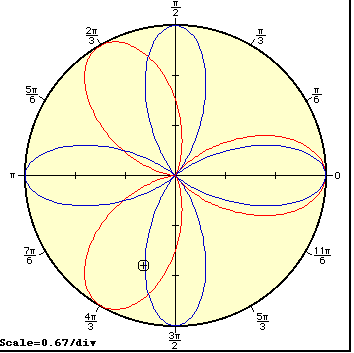
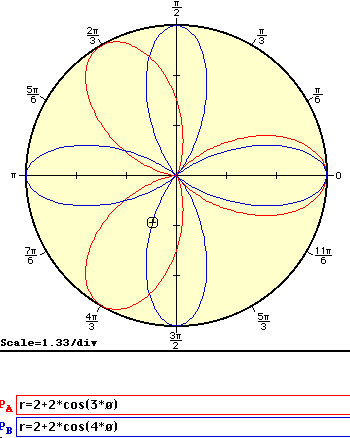
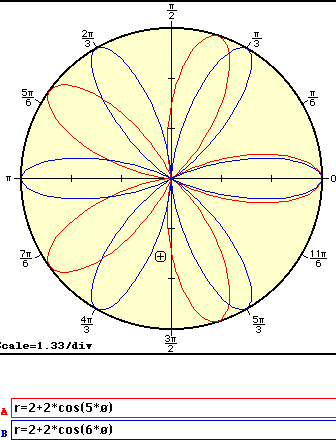
Note when k = 1 there was a single form, however as k increased a number of petals appeared. The number of petals increased according to the increse in k. When k = 2 there were two petals, when k = 5 there were five petals. Also note the radius for this graph is 2 units. Further investigation might show a pattern in finding the radius.
We will next look at a similar group of graphs however a = b= 2. Below is the list of graphs we will consider.
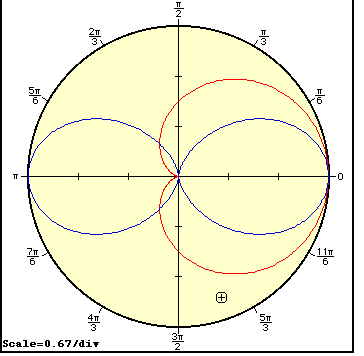
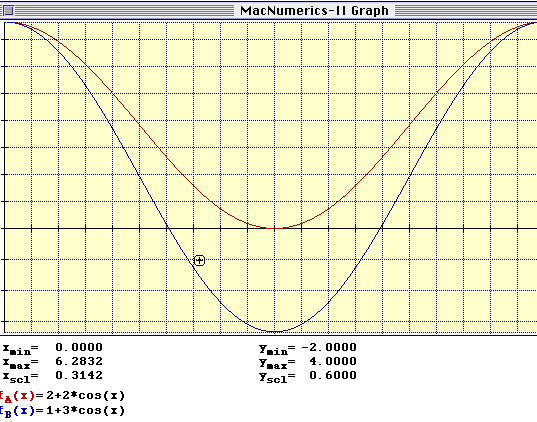
The first pair of graphs are: r = 2 + 2 cos (t) and r = 2 + 2 cos (2 t)
and 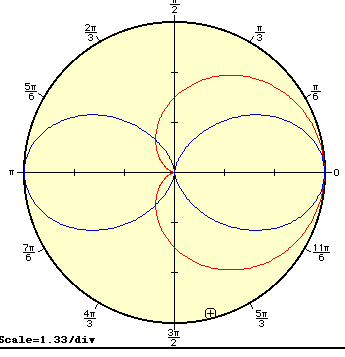
Note how the general shape of the graph looks like the initial r = 1 +cos (ø) and r = 1 + cos (2ø), but according to the scale we note that the radius is now 2 not 1 as it was before. We will look at a few more examples.
There seems to be a pattern emerging. Our conjecture is that if we looked at further examples with a = b = 3 or a = b = 4 we would find that the length of the radius is a + b, and the number of petals is k.
By looking at several examples we will see if our conjecture that a + b = radius and k determines the number of petals will hold for a< b. We will begin the investigation with the following graphs:

We see that there is no longer k petals, but what appears to be 2k petals.
Note also the small loop inside the larger one. We will look at several
more examples to try to find a generalization. We will next see ![]()
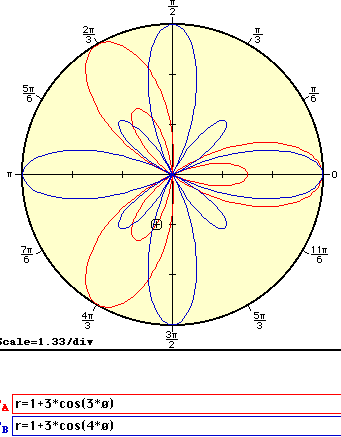
Note some of the petals are inside each other by some are not. We will next see

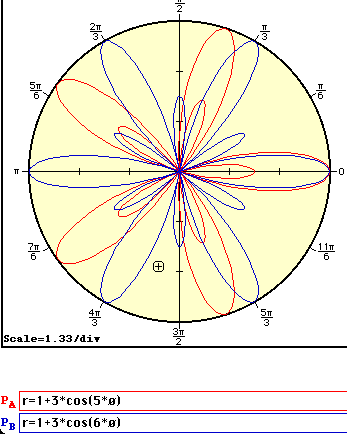
It appears that when k is an odd number there are 2k petals with the smaller petals inside the larger ones, however when k is even there are 2k petals each outside the other. Notice also according to the scale used the radius is still a + b.
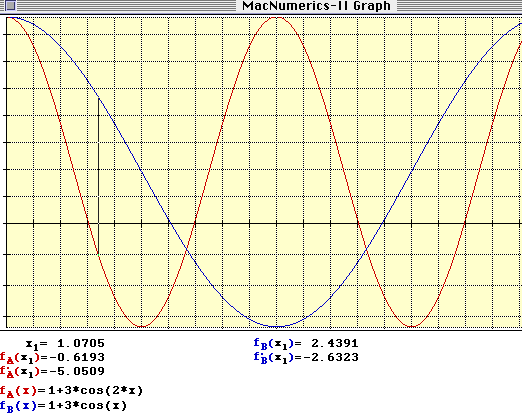
It is interesting that when looking at a =b examples we did not see the phenomenon of looping inside of petals. Upon further investigation we might see a connection to the Cartesian graphs of these functions. Note when a = b the sinusoidal axis is shifted up a units. The amplitude of the curve is b units. Because these are equal there are no values of this function that are negative. When we allow a < b however, the sinusoidal axis is shifted up less than the amplitude of the curve and we find negative values which are expressed as inside loops in the polar graph. See the graph below.
The only difficulty with this explanation is that when we look at values that have a< b and k is even the smaller petals still remain outside the larger ones even though there are negative values for the function. See below.
Also what happens when a and b are negative values? For the case that a<b and a and b are negative we will see a reflection over the vertical axis. If k is odd it is apparent that the graphs are reflections, however if k is even ,due to the symmetry of the curves, it is more difficult to see. See below.
If only a is negative there appears to be no effect on the polar graph. This is a translation on a Cartesian graph. (see below).

If only b is negative it is still a reflection of the curve over the vertical axis.
To recap when a< b we find our conjecture radius = a + b remains true, however in the graphs when a < b and k is odd the petals are 2k in number and smaller petals are inside larger ones. For even values of k there are 2k petals small and large alternating with no petals inside one another. If only b< 0 the polar graph reflects over the vertical axis. If only a< 0 there seems to be no effect on the polar graph.
Case III: Examine the graph of r = a + b cos(k t) for a > b
We will continue the investgation assuming that r = a + b and try to see how the graph is effected when a < b. We will use the following graphs to aid in our investigation.
It seems that when a>b we have no petals looped inside of others.
Again if we relate to the Cartesian graph the sinusoidal axis is translated
up 4 units and with an amplitude of 3 there are no negative values for the
function. This is consistent with earlier findings. The curves do seem to
be somewhat different however. See below.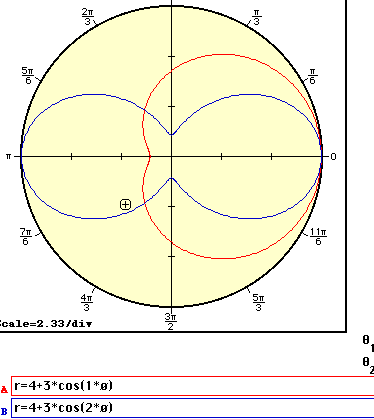
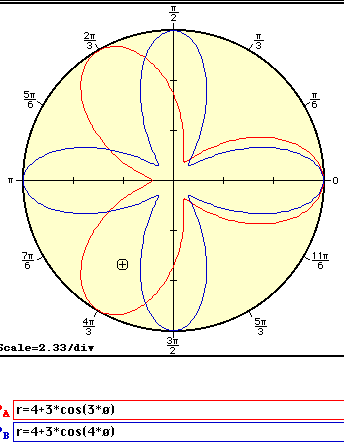
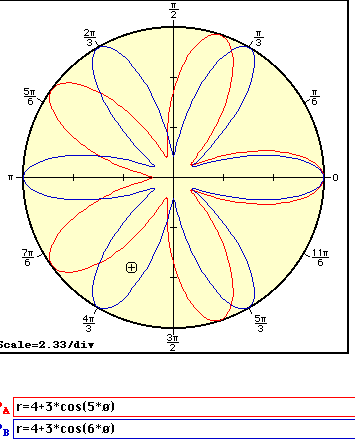
It seems that the overall shape of the curves has remained unchanged, however the petals do not touch each other. Upon further investigation we find that the further apart a and b become the more expanded the petals become. There are k petals in each graph when a< b.
In summary when a< b, the further apart a and b are the more stretched the curves become, there are k petals with no looping inside and also no crossing over each other, the radius remains a + b.
Click here to return to Final Assignment.
CLICK HERE TO RETURN TO HOME PAGE