
Assignment 1 Sandy Cederbaum
Beginning
with the values a=1, b=1, and c=1, we graph the
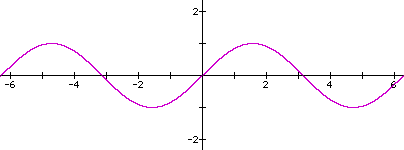
basic function y=sinx. This function has an Amplitude of 1 unit,Period a of ![]() , and a Phase Shift of 0 units. We will become more
familiar with these terms in this exploration so hang tight.
, and a Phase Shift of 0 units. We will become more
familiar with these terms in this exploration so hang tight.

Let us begin by exploring the effects of using different values of a in the function y=asinx. Click here in order to see what happens to the graph of y=asinx as the value of a changes over the set of real numbers ranging from -8 to 8. As we can see, the amplitude of the graph changes accordingly.
What appears to have happened to the graph of y= asinx as compared to y=-asinx? Look at the following example where we compare the graph of y=3.2sinx and y=-3.2sinx on the same set of axes. Conclusion. Both of the graphs below are said to have an amplitude of 3.2 (the absolute value of a).

What happens to the graph when a=0?
Sketch the graphs: y=0.5sinx , y=4.2sinx , and y=-7sinx.
Let us next explore what happens to the function y=sin(bx) when we allow b to vary over the set of real numbers from -8 to 8. Click here in order to see how the graph is effected. Write a few sentences to describe the effect that the changing b values have on the graph of y=sin(bx) for 0<b<1 and for b>1 if we define the period of the sine function to be the number of units (degrees or radians) in one complete cycle of the graph.
Did you conclude that the period of the graph is effected by the changes in the value of b?
How can we find the period of the graph of y=sin(bx)?
Sketch the graphs of
![]() ,
, ![]() and determine the period of each graph. Click here
to see how to find the period of these graphs.
and determine the period of each graph. Click here
to see how to find the period of these graphs.
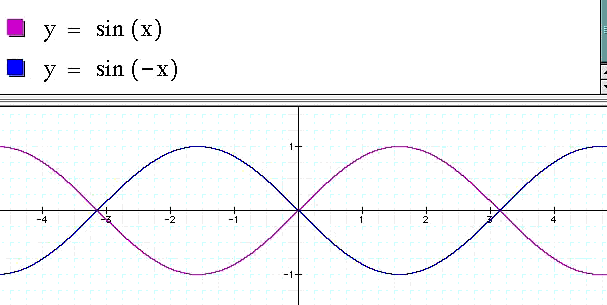
What appears to have happened to the graph of y=sin(bx) as compared to y=sin(-bx)? Look at the following example where we have graphed y=sin(-1x) and y=sin(1x) on the same set of axes.

Here the sine function
is deceiving because we could interpret our results as a vertical
flip (a flip over the x-axis). However, if we do a little analysis
and/or plug in some reasonable values for x in both equations
(try x=![]() ,
, ![]() ,
and
,
and ![]() ), we see that opposite x values
return the same y values. Thus we actually have a "horizontal
flip". We can think of it as flipping the graph over the
y-axis.
), we see that opposite x values
return the same y values. Thus we actually have a "horizontal
flip". We can think of it as flipping the graph over the
y-axis.
Let
us next explore the graph of y=sin(x+c) as c varies. Click here to see an animation
of the graph as the value of c varies from -5 to 5. Write a few sentences
to describe the effect that the changing c values have on the graph of y=sin(x+c). This horizontal
shifting of the graph is called a phase shift. Can you find the distance and
direction of the phase shift for the graphs of ![]() and
y=sin(x-7)? Here are the answers.
and
y=sin(x-7)? Here are the answers.
Now let us see what happens when we put all of the pieces together and vary the values of a, b, and c. Graph the following:
 see graph and explanation
Congratulations. You have just completed a study of transformations of the graph of y=asin(bx+c). You should feel fairly comfortable sketching a fairly accurate graph of any awkward sine function using what you now know about the Amplitude, Period and Phase shift of y=asin(bx+c). As an extension of this exploration, you may want to consider what happens to the graph when we add a constant (y=d+asin(bx+c)).