As a
changes...
In the above graph, a=1, b=1, and c=0.
What happens to the graph when the value of a changes? Choose
several examples to explore.


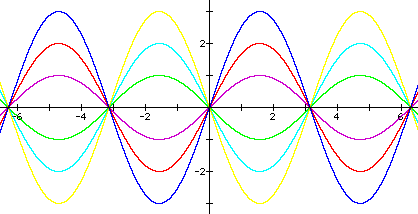
The original sine graph, with a=1, is in purple.
As a changes, the sine graph seems to be stretched along
the y-axis. This stretch changes the height, or the amplitude
of the sine graph.
For example, when a=1, the y-value of the sine function varies between
-1 and 1. However, when a=3, the y-value varies between -3 and 3.
Moreover, when a takes on a negative
value, the sine graph flips, or reflects over the x-axis. For
an example, compare the graphs of y
= sin x and y
= -sin x. When x=  , sin x takes on a
value of 1 while -sin x takes on a value of -1.
, sin x takes on a
value of 1 while -sin x takes on a value of -1.