The Department of Mathematics Education

It has now become a rather standard exercise, with available
technology, to construct graphs to consider the equation
by overlaying several graphs of
for different values of a, b, or c as the other two are held
constant. For example, if we set
for , b = -3, -2, -1, 0, 1, 2 and 3 and overlay the graphs, the following picture is obtained.
b = -3, -2,
-1, 0,
1, 2,
3

Now consider the solutions to the quadratic ![]() for
b = -3, -2, -1, 0, 1, 2 and 3. The solutions of a quadratic equation
are related to the discriminant,
for
b = -3, -2, -1, 0, 1, 2 and 3. The solutions of a quadratic equation
are related to the discriminant, ![]() . The
following table lists the values of the discriminant for the quadratics
under consideration:
. The
following table lists the values of the discriminant for the quadratics
under consideration:
|
|
|
|
|
|
|
|
|
|
|
|
|
|
|
|
|
|
|
|
|
|
|
|
|
|
|
|
|
|
|
|
Reexamine the graphs of ![]() in light of the
information in the above table. Notice that when b = -2 and 2,
the graph is tangent to the x-axis. We would expect this to happen
because when y = 0 when b = -2 or 2, the resulting quadratic equation
has 1 solution. When -2 < b < 2, the graph does not intersect
the x-axis and the related quadratic has no real solutions. When
b = -3 and 3, the graph intersects the y-axis in two places. We
could use the points of intersection to approximate the irrational
solutions to the related quadratic equations as -0.4 and -2.6,
and 0.4 and 2.6, respectively.
in light of the
information in the above table. Notice that when b = -2 and 2,
the graph is tangent to the x-axis. We would expect this to happen
because when y = 0 when b = -2 or 2, the resulting quadratic equation
has 1 solution. When -2 < b < 2, the graph does not intersect
the x-axis and the related quadratic has no real solutions. When
b = -3 and 3, the graph intersects the y-axis in two places. We
could use the points of intersection to approximate the irrational
solutions to the related quadratic equations as -0.4 and -2.6,
and 0.4 and 2.6, respectively.
We wish to demonstrate that the locus of the vertices can be
represented by the equation:
as demonstrated by the following graph.
![]() graphed in red
graphed in red

Changing
to work form yields
Thus, the x-coordinates of the vertices of the parabolas determined by
can be represented by
while the y-coordinates can be represented by
This last equation can be rewritten as
Replacing -b/2 with x yields
Consider again the equation
Now graph this relation in the xb plane. We get the following
graph.

If we take any particular value of b, say b = 3, and overlay
this equation on the graph we add a line parallel to the x-axis.
If it intersects the curve in the xb plane the intersection points
correspond to the roots of the original equation for that value
of b. We have the following graph.

For each value of b we select, we get a horizontal line. It
is clear on a single graph that we get two negative real roots
of the original equation when b > 2, one negative real root
when b = 2, no real roots for -2 < b < 2, One positive real
root when b = -2, and two positive real roots when b < -2.
Consider the case when c = - 1 rather than + 1. In the next diagram,
we have overlayed the graph of ![]() (graphed
in red) on the previous graph.
(graphed
in red) on the previous graph.

Notice that any horizontal line y = b will intersect the graph
in two places, implying that the quadratic ![]() will
always have two real solutions. This makes sense when the discriminant
is considered again. The discriminant of
will
always have two real solutions. This makes sense when the discriminant
is considered again. The discriminant of ![]() would
be
would
be ![]() or
or ![]() which
would always produce a positive value. A positive discriminant
implies 2 real solutions.
which
would always produce a positive value. A positive discriminant
implies 2 real solutions.
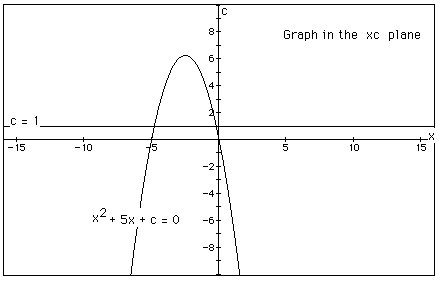
In the following example the equation
is considered. If the equation is graphed in the xc plane,
it is easy to see that the curve will be a parabola. For each
value of c considered, its graph will be a line crossing the parabola
in 0, 1, or 2 points -- the intersections being at the roots of
the orignal equation at that value of c. In the graph, the graph
of c = 1 is shown. The equation
will have two negative roots -- approximately -0.2 and -4.8.

There is one value of c where the equation will have only 1
real root -- at c = 6.25. For c > 6.25 the equation will have
no real roots and for c < 6.25 the equation will have two roots,
both negative for 0 < c < 6.25, one negative and one 0 when
c = 0 and one negative and one positive when c < 0.