For the following equations:
The influence of the coefficents, a and b will be explored prior to the exploration of a more complicated pair of parametric equations based upon the aforementioned equations.
When a = b the graphs will be:
where a = b = 3
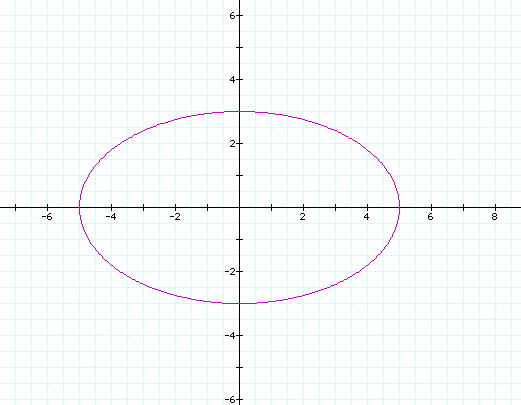
When a > b the graphs will
be:
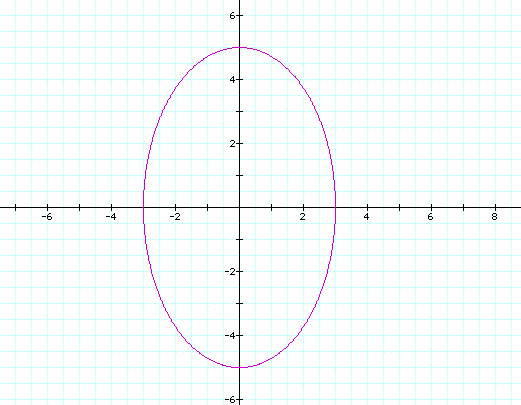
When a > b the graphs will
be:
where a = 3, b = 5
Observations:
For the following graphs you may have noticed that at a=b the graph will resemble a circle, when a is either greater than or less than b, the graph will resemble a ellipse whose major axis will depend on the greater coefficient. For an analytical approach, you can click on each perspective graph and it will link you to an excel spreadsheet and chart.
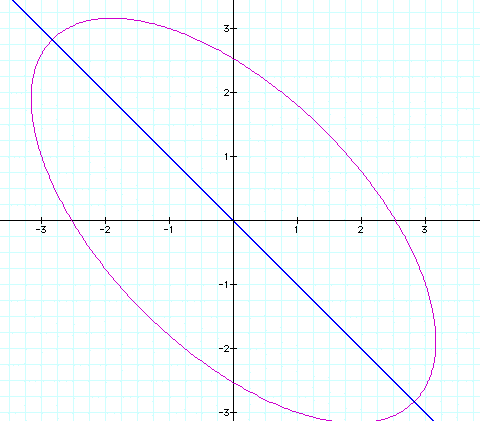
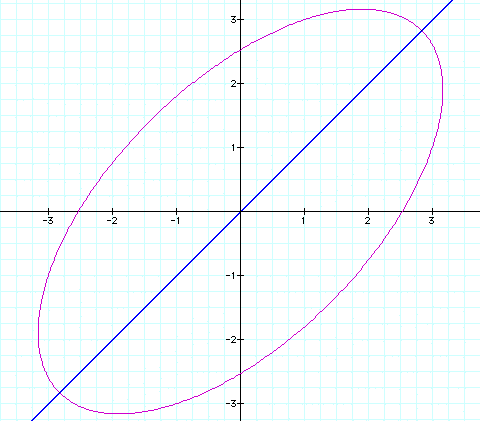
The behavior of the graph distinctly changes. Instead of symmetry about the x or y axes, you have asymmetrical graphs, which at first appear symmetric about the lines y=x or y=-x shown in blue.
at h>0  at h<0
To view a movie depicting the varying value of h click here ->
Questions? E-mail: gt0353d@arches.uga.edu