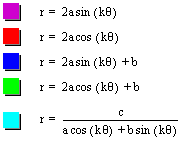

In this investigation we will be exploring polar equations. We are going to look at the following equations:
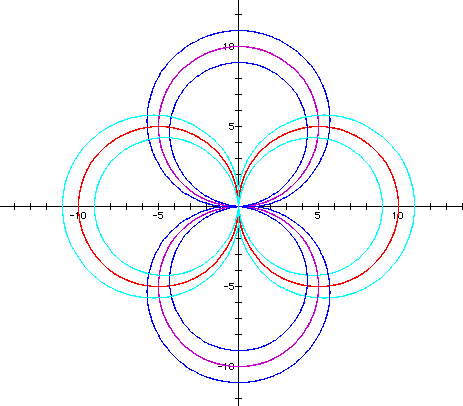
These equations yield a graph that appears as: (when a,b, c, and k are set to one and
is set between -2
and 2
)

Where the graph can be labeled as follows:

In order to really understand what this means and what changes we will want to make, we must first examine what the curves look like individual with variation.
To examine different variations with ![]() , click
here.
, click
here.
To examine different variations with ![]() , click
here.
, click
here.
To examine different variations with ![]() , click
here.
, click
here.
To examine different variations with ![]() , click
here.
, click
here.
And finally to examine different variations
with ![]() , click
here.
, click
here.
Now that these particular cases have been examined, we can change our values of a, b, c, and k and examine how the graph would change. Some particular graphs I found interesting were:


Try some on your own and see what you like...