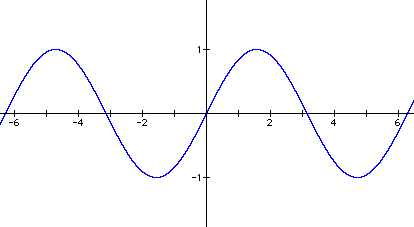
I set a=1 and c=0, which gave the equation y = sin bx. I then tried different values for b and graphed the results. Some examples follow.

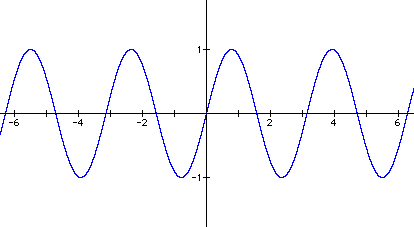
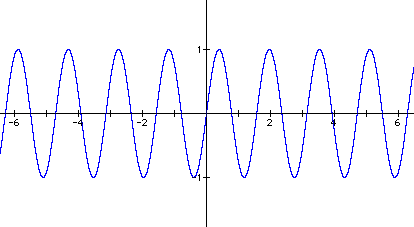
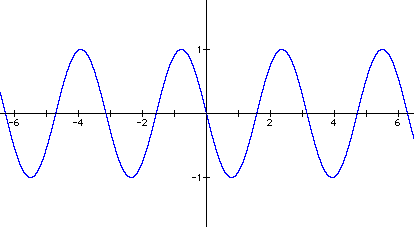
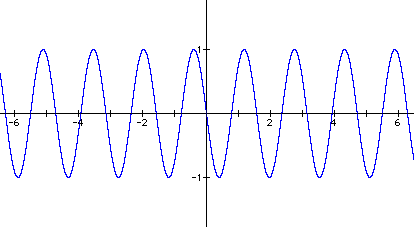
Changing the value of b affected the period of the equation. It basically stretched or shrank the graph horizontally. For b = 2, the period was changed by a factor of 1/2. For b = 4, the period was changed by a factor of 1/4. For b = -2, the period was changed by a factor of 1/2 and the graph was reflected about the x-axis. For b = -4, the period was changed by a factor of 1/4 and again the graph was reflected about the x-axis.
It appears that for any b, the period is changed by a factor of 1/b. In addition, for negative values of b, the graph is reflected about the x-axis.
It is important to point out that the graph continued to pass through the point (0,0) regardless of how b was changed. When x = 0, it does not matter what the value of b is since bx will always equal 0. The result is that when x = 0, sin bx = sin x for any value of b. Therefore, the graph will always pass through the origin.
Click here to see an animated graph of this equation.