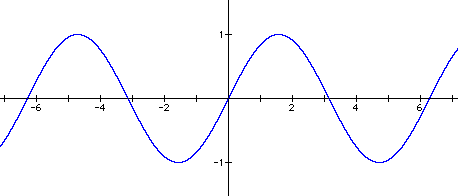
I set a=1 and b=1, which gave the equation y = sin (x + c). I then tried different values for c and graphed the results. Some examples follow.

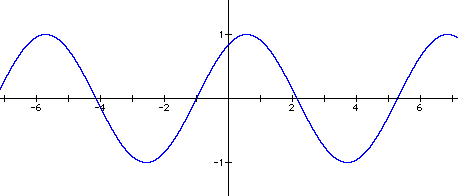
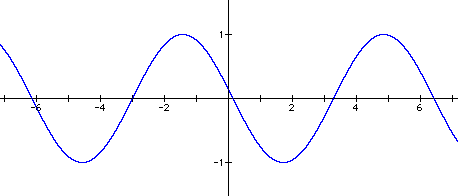
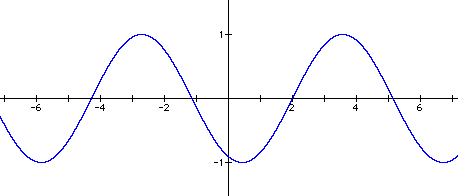
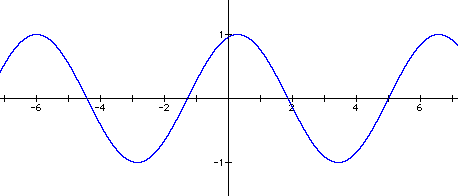
Changing the value of c caused the graph to slide horizontally along the x-axis. When c = 1, the graph moved a distance of -1 along the x-axis. When c = 3, the graph moved a distance of -3 along the x-axis. When c = -2, the graph moved a distance of 2 along the x-axis. And when c = -5, the graph moved a distance of 5 along the x-axis. This movement can be seen by comparing the x-intercepts on the various graphs to the x-intercepts of the first graph, y = sin x.
It appears that for any c, the graph will slide a distance of - c along the x-axis.
It is important to point out that in this case neither the amplitude nor the period was changed by different values of c. The effect of c on the equation is to change the value of x before any other function is performed. The result is a horizontal shift of the graph.
Click here to see an animated graph of this equation.