

It has now become a rather standard exercise, with available technology, to construct graphs to consider the equation
ax^2+bx+c=0, and to overlay several graphs of y = ax^2+bx+c
for different values of a, b, or c as the other two are held constant:
For example, if a and c are held constant at 1 and if b is given the values of .5, 2 and 4, we can generate the following graph of the functions:

This shows us that changes in the x term will
change the location of the vertex, shifting the coordinates of
its location it along the x-axis and along the y-axis.
Similarly, if a and b are held constant at 1 and c is given the values of .5, 2 and 4:

We can see in the above graph that changing the constant term shifts the parabola up and down along the y-axis.
Or if b and c are held constant at 1 and a is given the values of values of .5, 2 and 4:

We can see that the coefficient on the x^2 term changes the shape of the parabola - a larger value on this term will widen the parabola.
These changes are interesting because they
give us an idea of how each term influences the shape of the graph,
and we see in the following section that these changes can also
be used to show how the roots of the equation change as the terms
of the equation are adjusted.
Graphs in the xb plane.
From the following graphs, discussion
of the patterns for the roots of ax^2 + bx + c=0 can be followed.
Consider again the equation x^2+bx+1=0.
Graphed in the xb plane, the relation produces the following graph:

Take any particular value of b, say b = 3, and overlay this equation on the graph. If it intersects the curve in the xb plane, the intersection points correspond to the roots of the original equation for that value of b. We have the following graph.

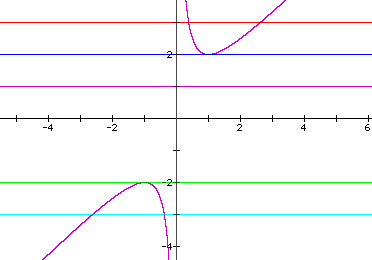
For each value of b we select, we get a horizontal line. It is clear on the single graph below that we get two negative real roots of the original equation when b > 2, one negative real root when b = 2, no real roots for -2 < b < 2, One positive real root when b = -2, and two positive real roots when b < -2.
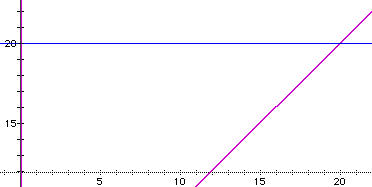
If we examine the graph for much larger values of b, for example, b=20, what could we expect? We see again that there must be two roots for the equation:
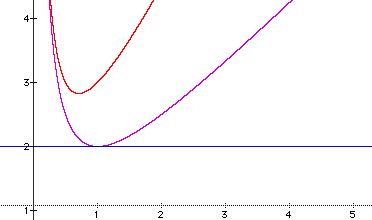
Or if we change the coefficient on the x^2term to 2 and add that graph to the original parabola and the line of b=2:

Consider the case when c = - 1 rather than + 1.
It is clear in the graph that for any value of b there will be two real roots for the relation. The illustrates for us that:
b = (x^2+1)/x has no solution for b=1,
but b = (x^2-1)/x does have a solution for b=1.
Graphs in the xc plane.
In the following example the equation x^2+5x+c
= 0 is considered. If the equation is graphed
in the xc plane, the curve will be a parabola. For each value
of c considered, its graph will be a line crossing the parabola
in 0, 1, or 2 points -- the intersections being at the roots of
the orignal equation for that value of c. In the graph below,
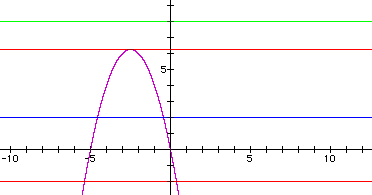
the graph of c = 1 is shown with the equation -x^2-5x=c
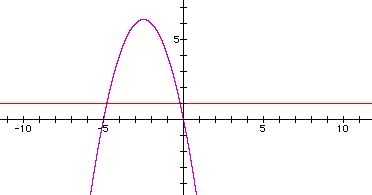
We can see that the equation will have two negative roots -- approximately -0.2 and -4.8.
There is one value of c where the equation will have only 1 real root -- at c = 6.25. For c > 6.25 the equation will have no real roots and for c < 6.25 the equation will have two roots, both negative for 0 < c < 6.25, one negative and one 0 when c = 0 and one negative and one positive when c < 0. This is illustrated below:
The examples given of graphs in the xb and xc plane establish a starting point from which one could change the shapes of the curves and placement of the line to explore further the existence of roots and their values.
Graphs in the ac plane
Let us further investigate by looking at graphs generated in the ax plane, starting with the graph of the equation: a=(-5x-1)/x^2
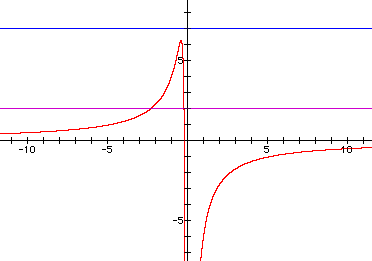
Graphed with a=2 and a=7. From here we see that when a=7, and b and c are assigned values 5 and 1 respectively, there are no real roots of the equation.
When b is also assigned the value 1, the graph takes on this shape:
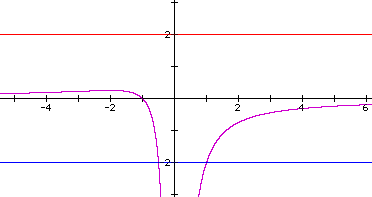
and no roots exist at a value of a above 1. We can return to the xy plane to verify this by checking for the graph of x^2+x+1=0 and finding that it does not exist.
As demonstrated here, using the form ax^2 + bx + c and graphing in the various planes can illustrate the effects each coefficient has on the roots of the equation. These illustrations can be illuminating to the student seeking to further understand quadratic equations.